")
")
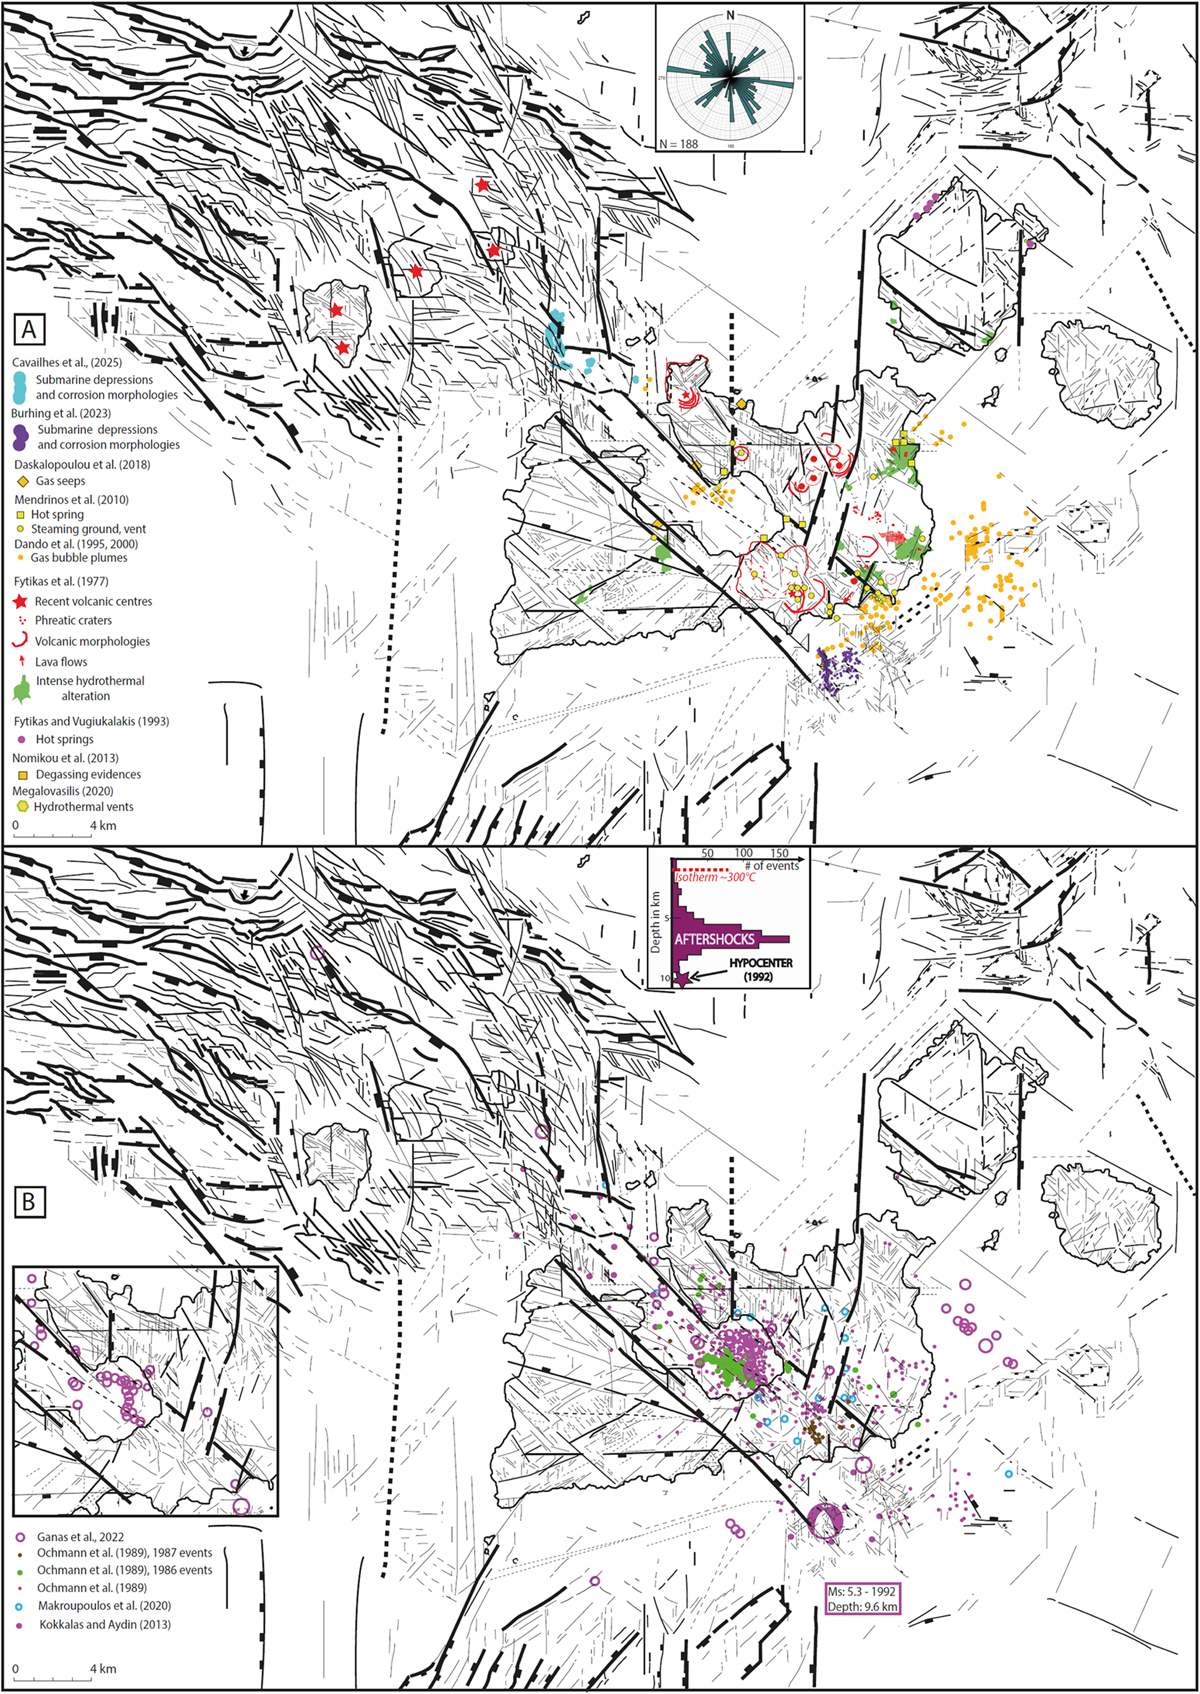
Fig. 5
Download original image
Structural sketch of the Milos archipelago derived from the physiographic analysis of Figure 4, showing the main structural lineaments (see the equal-area rose diagram for the strikes of the lineaments) and highlighting faults, fault propagation folds and fracture corridors. The Milos archipelago is located at the intersection of neotectonic volcanic grabens that express multidirectional extension. (A) The structural sketch is overlaid with the location of Quaternary volcanic centres, phreatic craters, hydrothermalized rocks (Fytikas, 1977) and hydrothermal vents (Fytikas and Vugiukalakis, 1993; Dando et al., 1995; Khimasia et al., 2021; Mendrino et al., 2010; Louis et al., 2003). (B) The structural sketch is crossplotted with the locations of the earthquake epicenters. References are on Figure 5B and comments are in the text. The inset on the left, taken from Ganas et al. (2022), shows the aligned epicentres along the NW-SE and N-S lineaments. The focal point mechanism shown in the figure is related to the earthquake that occurred the 20th of March 1992 (Delibasis, N. D., and Drakopoulos, J. C., 1993). The focal depth distribution of local earthquake is taken from Ochmann et al., (1989).
Schéma structural de l’archipel de Milos dérivée de l’analyse physiographique de la Figure 4, montrant les principaux linéaments structuraux (cf., projection stéréographique pour les orientations de linéaments) et mettant en évidence les failles, les plis de propagation des failles et les couloirs fracturés. L’archipel de Milos est situé à l’intersection de grabens volcaniques néotectoniques exprimant une extension multidirectionnelle. (A) Le schéma structural est superposé à l’emplacement des centres volcaniques quaternaires, des cratères phréatiques, des roches hydrothermales (Fytikas, 1977) et des évents hydrothermaux (Fytikas et Vugiukalakis, 1993; Dando et al., 1995; Khimasia et al., 2021; Mendrino et al., 2010; Louis et al., 2003). (B) Le schéma structural est superposé aux localisations des épicentres de séismes. Les références figurent sur la Figure 5B et les commentaires sont dans le texte. L’encart à gauche est issu de Ganas et al. (2022) et montrent les épicentres de séismes alignés sur les linéaments NW-SE et N-S. Le mécanisme du foyer représenté sur la figure est lié au séisme qui s’est produit le 20 mars 1992 (Delibasis and Drakopoulos 1993). La distribution des hypocentres de séismes est issue de Ochmann et al., (1989).
Current usage metrics show cumulative count of Article Views (full-text article views including HTML views, PDF and ePub downloads, according to the available data) and Abstracts Views on Vision4Press platform.
Data correspond to usage on the plateform after 2015. The current usage metrics is available 48-96 hours after online publication and is updated daily on week days.
Initial download of the metrics may take a while.