")
")
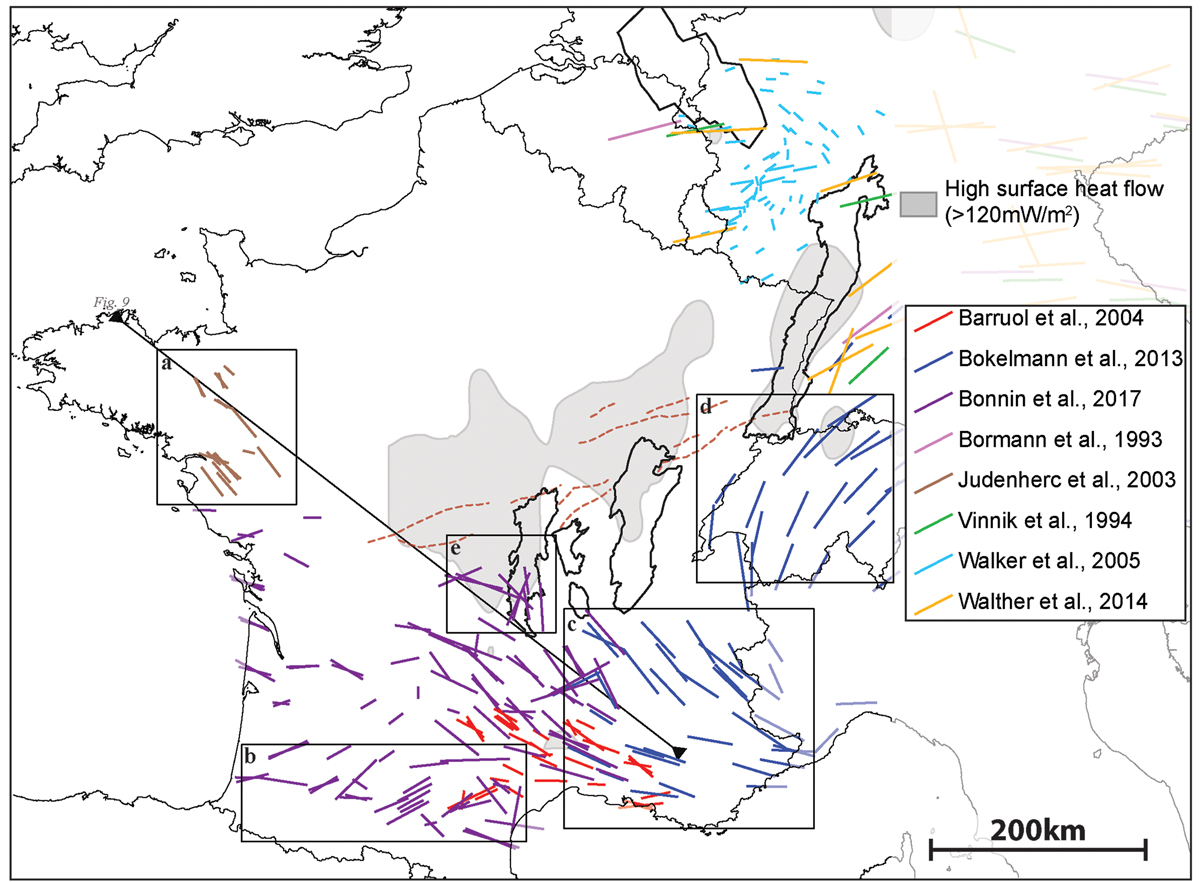
Fig. 8
Download original image
Compilation of SKS splitting data. Red: measurements from Barruol et al. (2004), dark blue: measurements from Bokelmann et al. (2013), purple: measurements from Bonnin et al. (2017), pink: measurements from Bormann et al. (1993), brown: measurements from Judenherc et al. (2003), green: measurements from Vinnik et al. (1994), light blue: measurements from (Walker et al. (2005), orange: measurements from Walther et al. (2014). SKS splitting data have good lateral but poor vertical resolution and constrain the upper mantle anisotropy (Wüstefeld et al., 2009; Vauchez et al., 2012; Tommasi and Vauchez, 2015). The high surface heat flow areas are defined from Figure 3B.
Current usage metrics show cumulative count of Article Views (full-text article views including HTML views, PDF and ePub downloads, according to the available data) and Abstracts Views on Vision4Press platform.
Data correspond to usage on the plateform after 2015. The current usage metrics is available 48-96 hours after online publication and is updated daily on week days.
Initial download of the metrics may take a while.