")
")
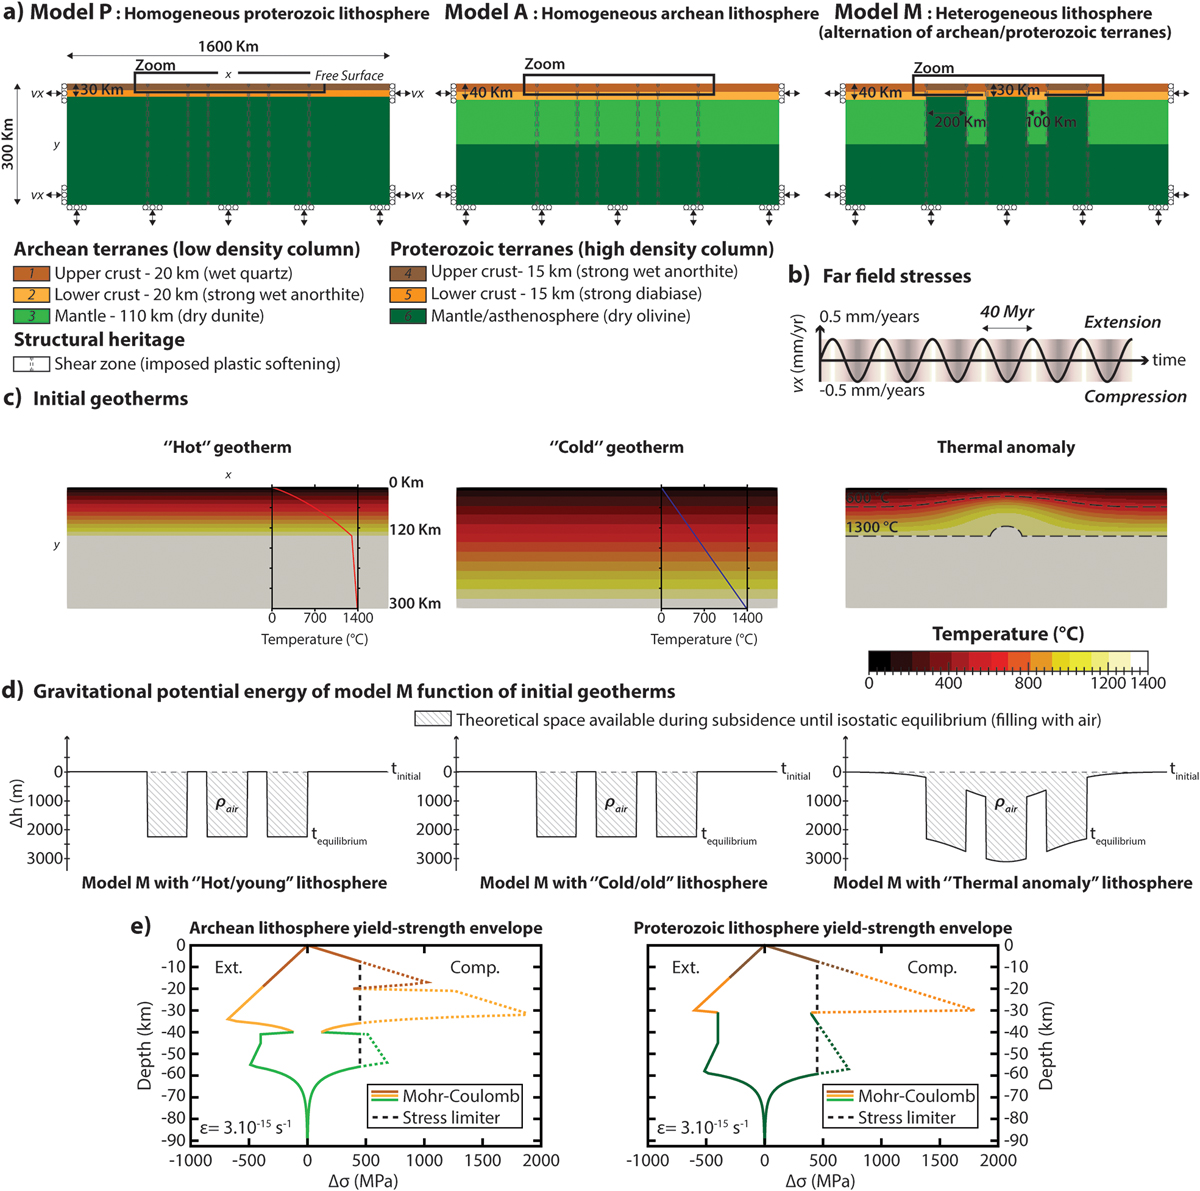
Fig. 4
Download original image
(A) Inputs models (model P, A and M) of the different simulations with the different parameters applied in experiments such as (B) the far field stresses (sinusoidal extension-compression 40 Myr) and (C) initial temperatures of the lithosphere (thermal anomaly, “hot” and “cold” geotherms). (D) Gravitational potential energy: Theoretical space available for the basin subsidence according to local isostatic equilibrium of model M for each different initial geotherms (basins filled with air). (E) Yield-strength envelopes (Mohr-Coulomb representation) for Archean and Proterozoic lithosphere with a “Hot” geotherm calculated for a strain rate of 3.10−15 s−1 and a stress limiter at 450 MPa (value from Watremez et al., 2013). Δσ represents the deviatoric stress, positive values under extension and negative values under compression.
Current usage metrics show cumulative count of Article Views (full-text article views including HTML views, PDF and ePub downloads, according to the available data) and Abstracts Views on Vision4Press platform.
Data correspond to usage on the plateform after 2015. The current usage metrics is available 48-96 hours after online publication and is updated daily on week days.
Initial download of the metrics may take a while.