")
")
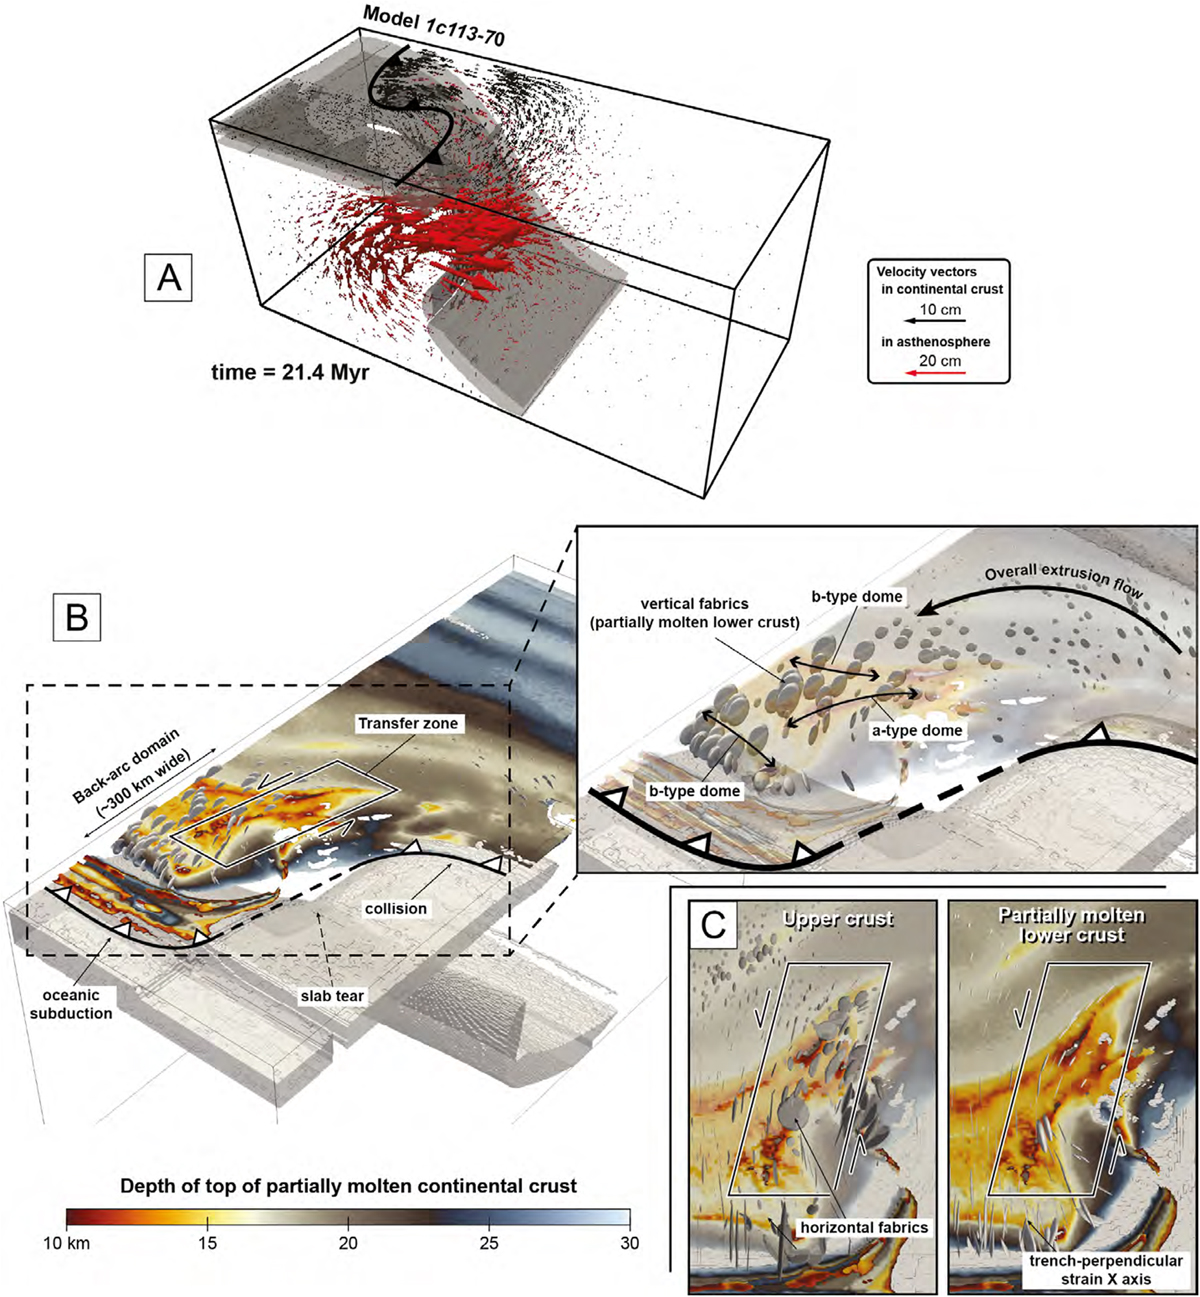
Fig. 16
Download original image
Lithospheric-scale 3-D numerical model of Menant et al. (2016a, 2016b). A: mantle velocity field (red arrows), crustal velocity field (black arrows). B: 3-D view from above showing the depth of the top of the lower molten crust in the back-arc region and the finite strain ellipsoids in the lower crust and the position of a-type and b-type domes. C: map view of details of the model focused on the transfer zone above the slab tear showing in addition finite strain ellipsoids in the upper crust.
Current usage metrics show cumulative count of Article Views (full-text article views including HTML views, PDF and ePub downloads, according to the available data) and Abstracts Views on Vision4Press platform.
Data correspond to usage on the plateform after 2015. The current usage metrics is available 48-96 hours after online publication and is updated daily on week days.
Initial download of the metrics may take a while.