")
")
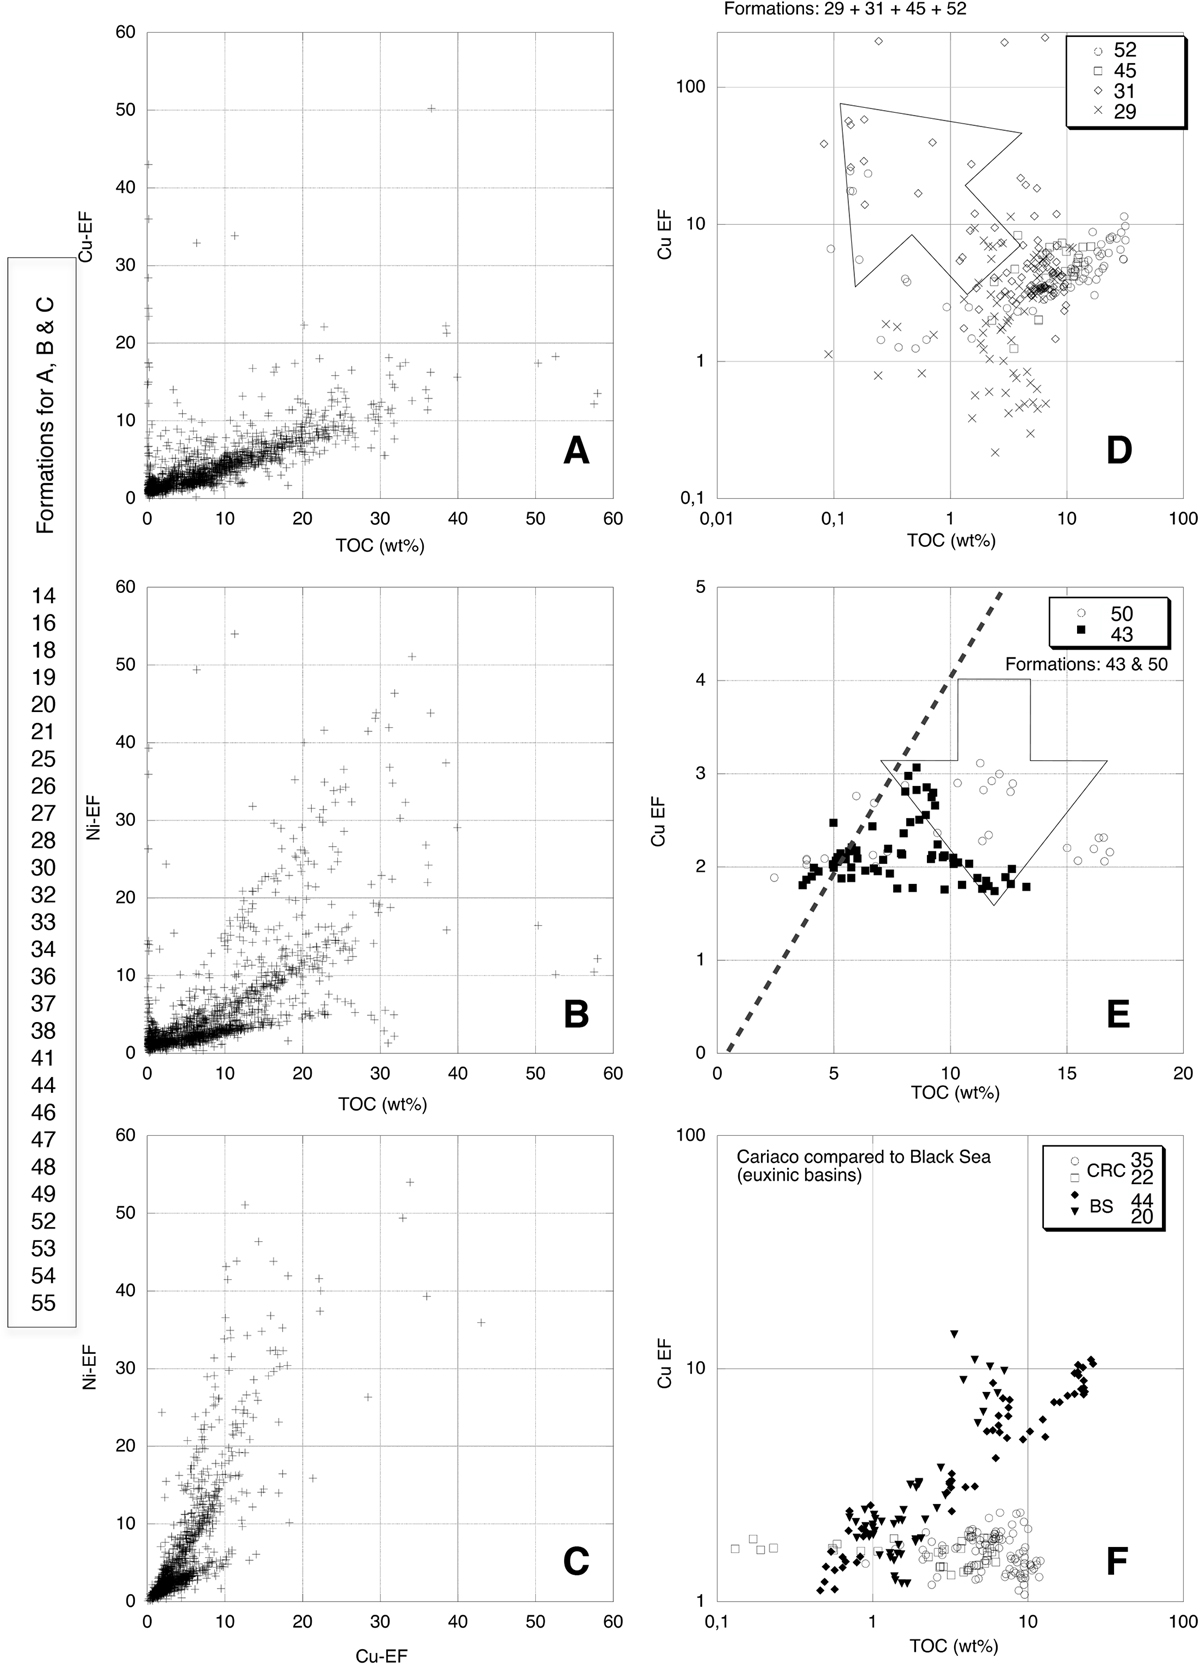
Fig. 1
Download original image
Relationships between the content in total organic carbon (TOC) and the enrichment factors in copper (Cu-EF, panel A) or nickel (Ni-EF, panel B) for the 27 formations listed on the left-hand side of the figure. The formation names are listed in Table 1. Panel C shows the cross diagram opposing the enrichment factors in Cu and Ni for the same formations. Panel D illustrates the relationships between TOC and Cu-EF for the formations 29, 31, 45 and 52 with samples yielding relative excess in Cu compared to the TOC values (arrow). Panel E: same diagram for formations 43 and 50, showing a relative deficit in Cu compared to the TOC values (arrow). Panel F: same diagram for the samples of two modern euxinic basins, the Cariaco Basin (formations 22 and 35) and the Black Sea (formations 20 and 44).
Current usage metrics show cumulative count of Article Views (full-text article views including HTML views, PDF and ePub downloads, according to the available data) and Abstracts Views on Vision4Press platform.
Data correspond to usage on the plateform after 2015. The current usage metrics is available 48-96 hours after online publication and is updated daily on week days.
Initial download of the metrics may take a while.