")
")
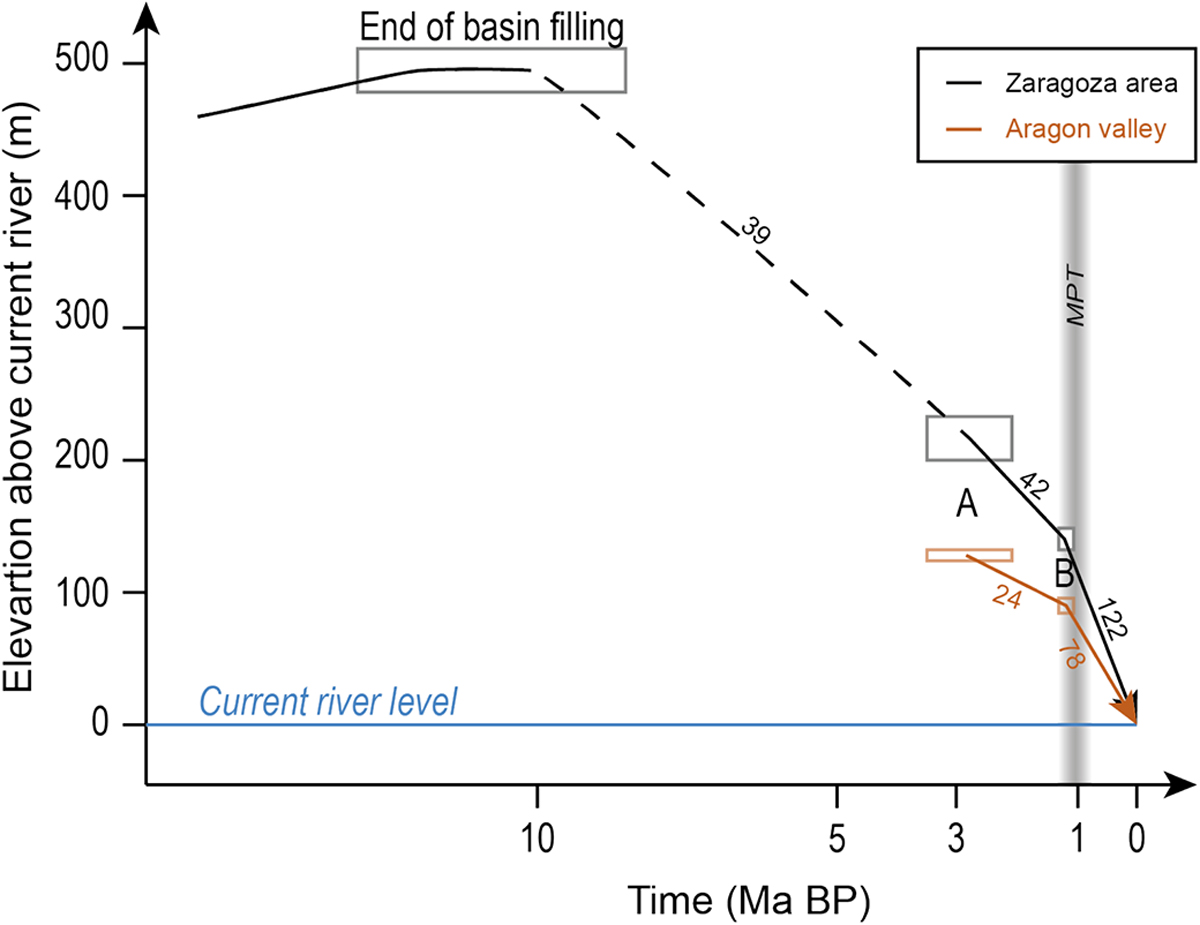
Fig. 10
Download original image
Incision in the Ebro Basin since 10 Ma in two key areas, the Zaragoza area (black) where the end of basin infilling is recorded, and the Aragón valley (brown). Rectangles figure the constraints. Numbers represent the incision rate in m/Ma. The path for the period between 10 and 3 Ma is shown with a dashed line, which figures the possibility the current topmost strata has been buried for a while (García-Castellanos and Larrasoaña, 2015). The Zaragoza area does not show a marked change at ∼ 3 Ma. On the contrary, both records suggest a threefold increase in incision rates after the MPT.
Current usage metrics show cumulative count of Article Views (full-text article views including HTML views, PDF and ePub downloads, according to the available data) and Abstracts Views on Vision4Press platform.
Data correspond to usage on the plateform after 2015. The current usage metrics is available 48-96 hours after online publication and is updated daily on week days.
Initial download of the metrics may take a while.