")
")
Fig. 16
Download original image
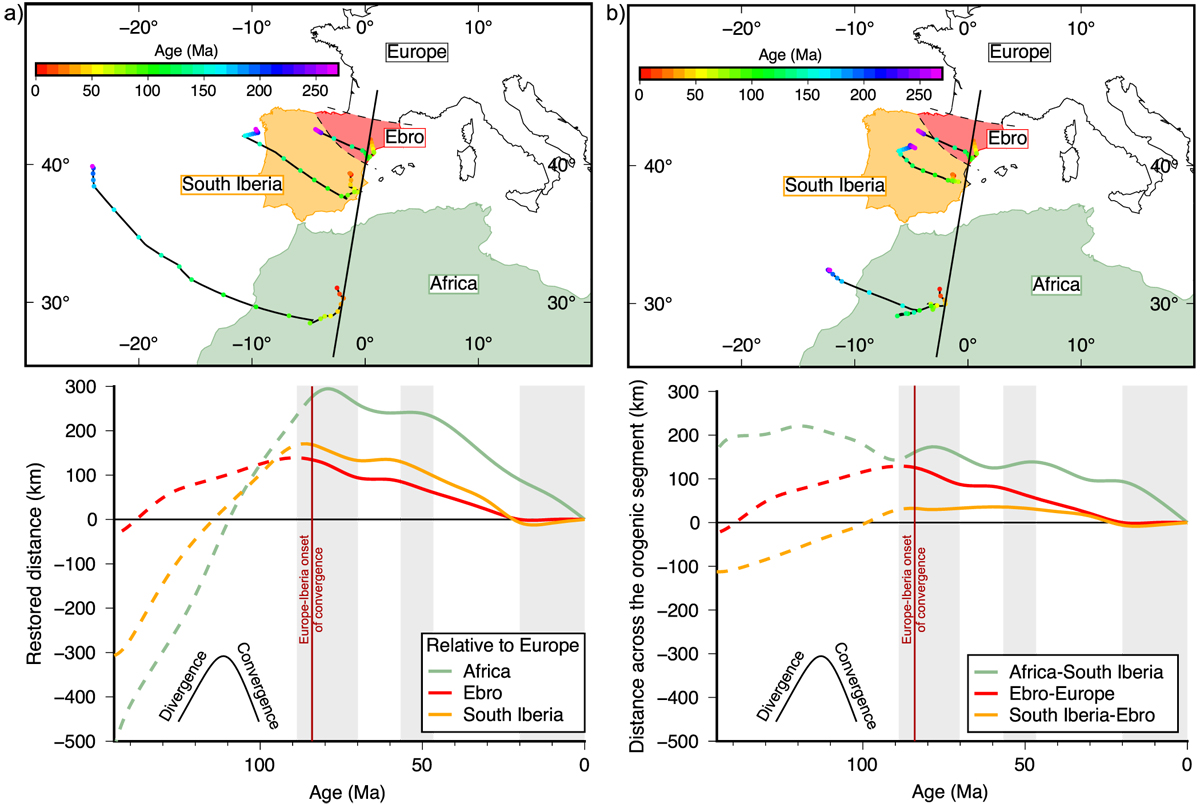
(a) Top: Motion paths of Ebro, South Iberia, and Africa relative to Europe. Bottom: Calculated restored distance (northward migration) between Africa (green), Ebro (red), and South Iberia (orange) relative to Europe since 145 Ma. Motion paths are plotted along a N10°E axis, which is parallel to the main transport direction during the converging phase. Note that before 84 Ma, the curve cannot be used for quantitative analyses because of the high amount of strike-slip movement. (b) Top: Motion paths of Ebro relative to Europe, South Iberia relative to Ebro, and Africa relative to South Iberia. Bottom: Calculated distance between Africa and South Iberia (green), Ebro and Europe (red), and South Iberia and Ebro (orange) since 145 Ma. Motion paths are plotted along a N10°E axis, parallel to the main transport direction during convergence. Note again that, before 84 Ma, the curve cannot be used for quantitative analyses because of the high amount of strike-slip.
Current usage metrics show cumulative count of Article Views (full-text article views including HTML views, PDF and ePub downloads, according to the available data) and Abstracts Views on Vision4Press platform.
Data correspond to usage on the plateform after 2015. The current usage metrics is available 48-96 hours after online publication and is updated daily on week days.
Initial download of the metrics may take a while.