")
")
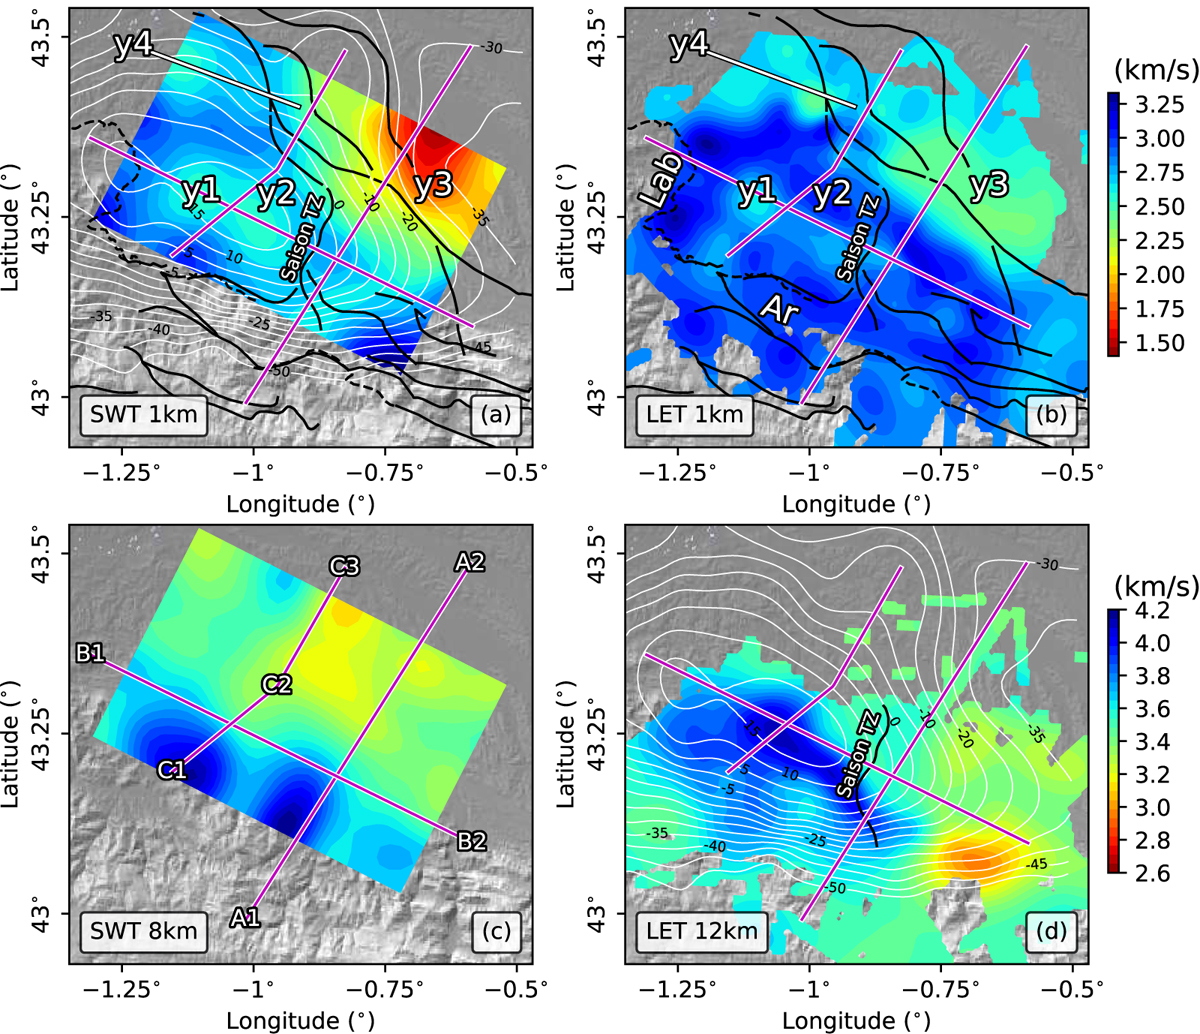
Fig. 10
Download original image
Map views of VS models from SWT (a,c) and LET (b,d) at several depths. The pink lines indicate the positions of sections A1-A2, B1-B2, C1-C2-C3 shown in Figures 11–16. The anomalies y1 to y4 are discussed in the text. The thick black lines correspond to main faults and the thin black dashed line corresponds to the basement-sediment interface to the south of the Mauléon Basin. The thin white lines in maps (a, d) correspond to the contour of the Bouguer anomaly in mgal from Figure 2A. Maps (a, b) and (c, d) share the same color bar. Ar: Arbailles Massif; Lab: Labourd Massif; Saison TS: Saison Transverse Structure.
Current usage metrics show cumulative count of Article Views (full-text article views including HTML views, PDF and ePub downloads, according to the available data) and Abstracts Views on Vision4Press platform.
Data correspond to usage on the plateform after 2015. The current usage metrics is available 48-96 hours after online publication and is updated daily on week days.
Initial download of the metrics may take a while.