")
")
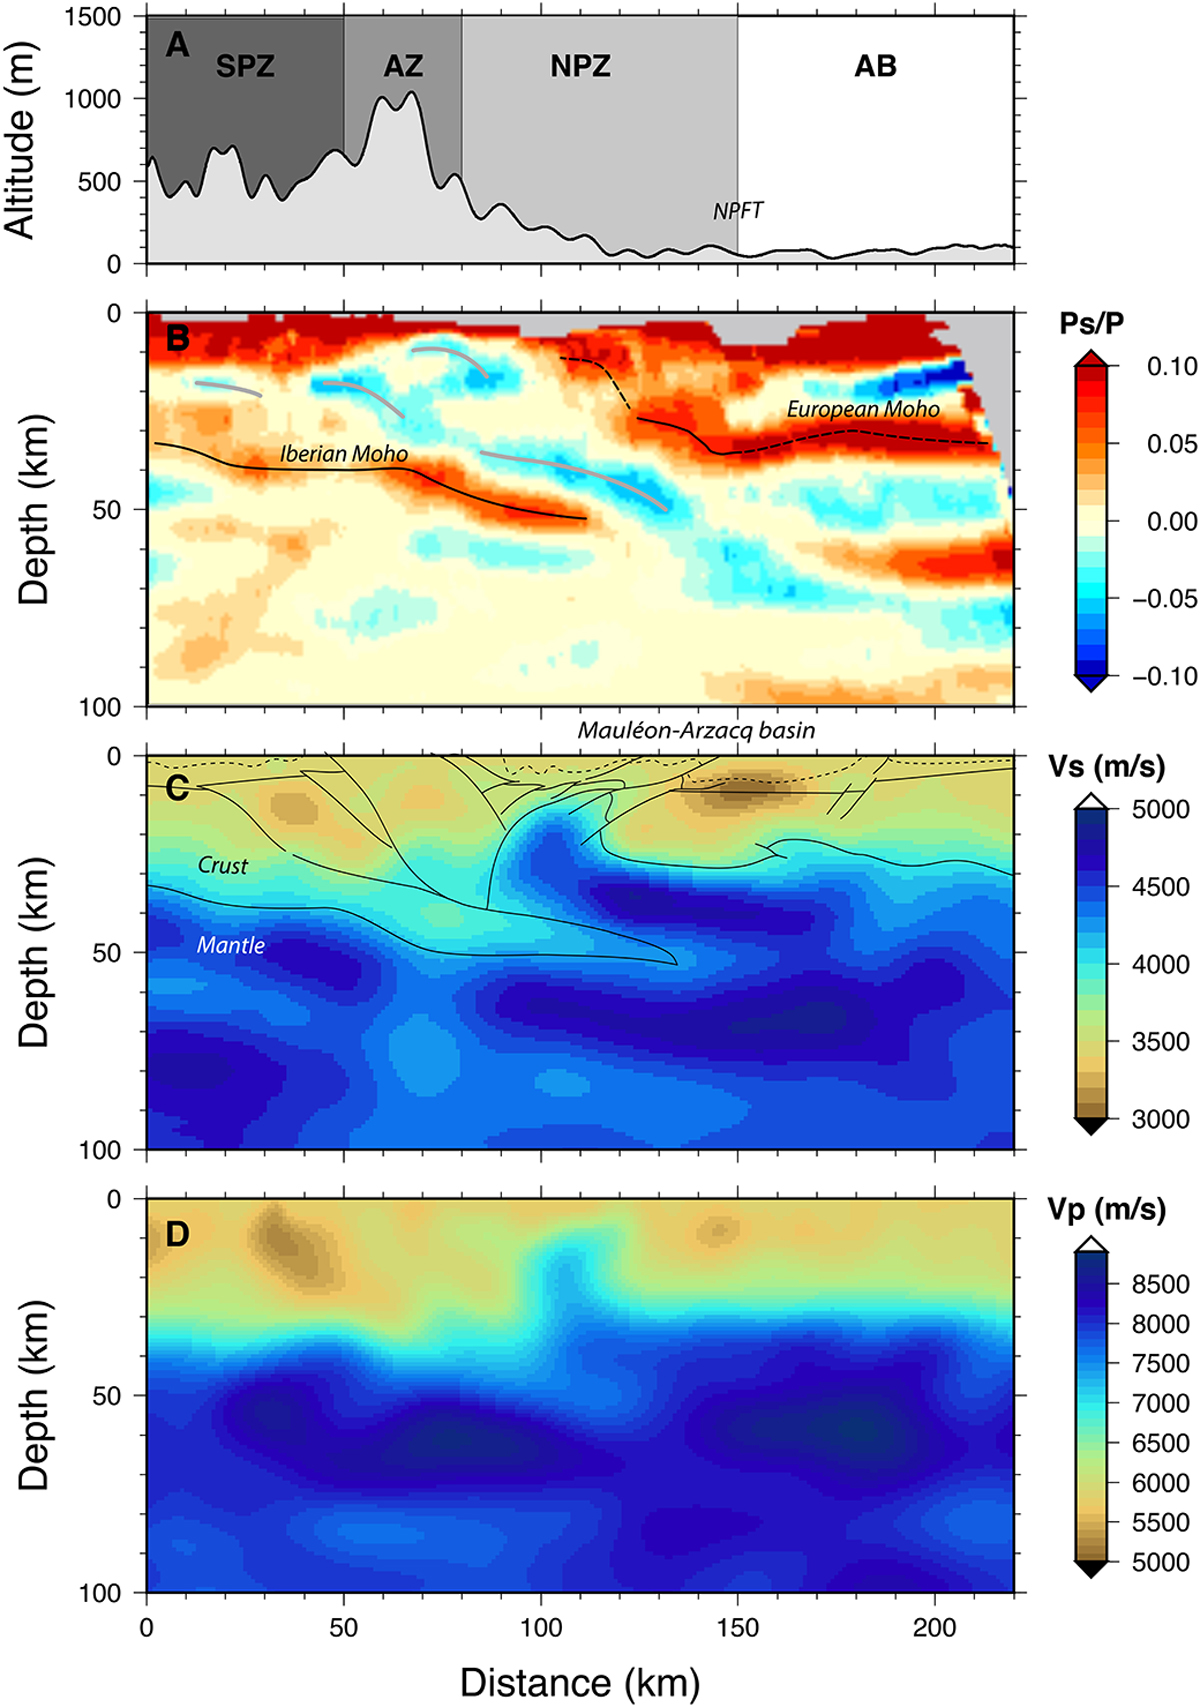
Fig. 11
Download original image
A: Surface topography (in meters) along the westernmost Pyrenean transect (Fig. 3B) which crosses from south to north the South Pyrenean Zone (SPZ), Axial Zone (AZ), North Pyrenean Zone (NZ) and Aquitaine Basin (AB). B: Section of migrated receiver functions. The Iberian and European Moho are delineated with black lines. The grey lines mark the seismic interfaces characterized by a negative downward velocity jump. C: Vs (top) and D: Vp (bottom) models (in m/s) obtained by full waveform inversion of teleseismic P waves. The thin black lines in C propose a preliminary geological interpretation of the tomographic model (from Wang et al., 2016).
Current usage metrics show cumulative count of Article Views (full-text article views including HTML views, PDF and ePub downloads, according to the available data) and Abstracts Views on Vision4Press platform.
Data correspond to usage on the plateform after 2015. The current usage metrics is available 48-96 hours after online publication and is updated daily on week days.
Initial download of the metrics may take a while.