")
")
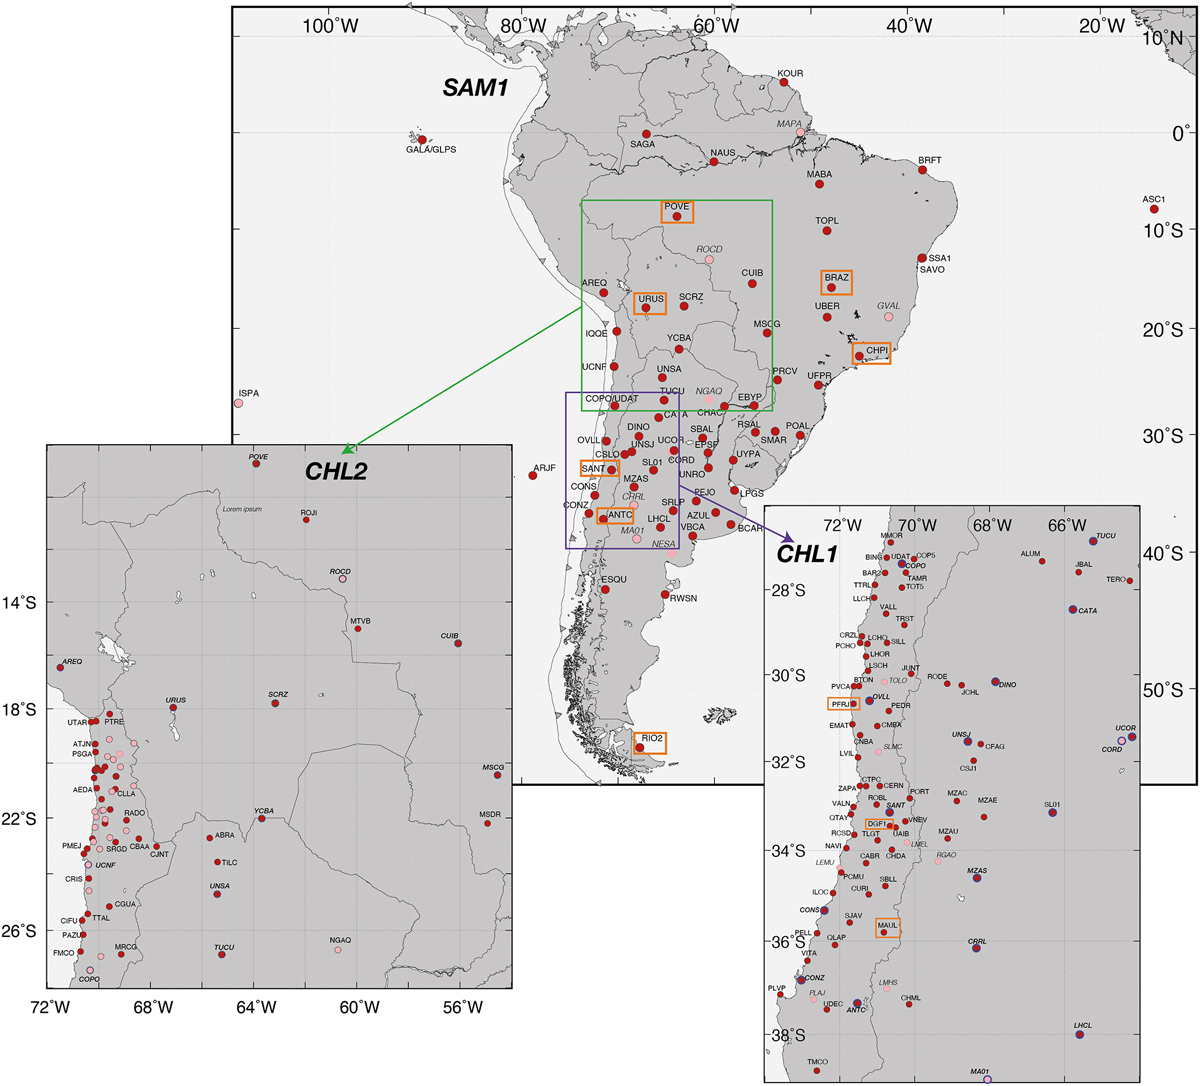
Fig. 1
Download original image
Maps of the 3 sub-networks used for the GAMIT processing. All stations are not present at every epochs, stations represented in pink did not send data for more than 2 years (either permanently decommissionned or temporary out of commission). On maps of sub-networks CHL1 and CHL2, stations commons to several sub-networks are highlighted by 2 different size circles. The network CHIL used for the processing until 2009 is not represented here. Stations highlighted by the orange frame are the one which time series are presented throughout the article.
Current usage metrics show cumulative count of Article Views (full-text article views including HTML views, PDF and ePub downloads, according to the available data) and Abstracts Views on Vision4Press platform.
Data correspond to usage on the plateform after 2015. The current usage metrics is available 48-96 hours after online publication and is updated daily on week days.
Initial download of the metrics may take a while.