")
")
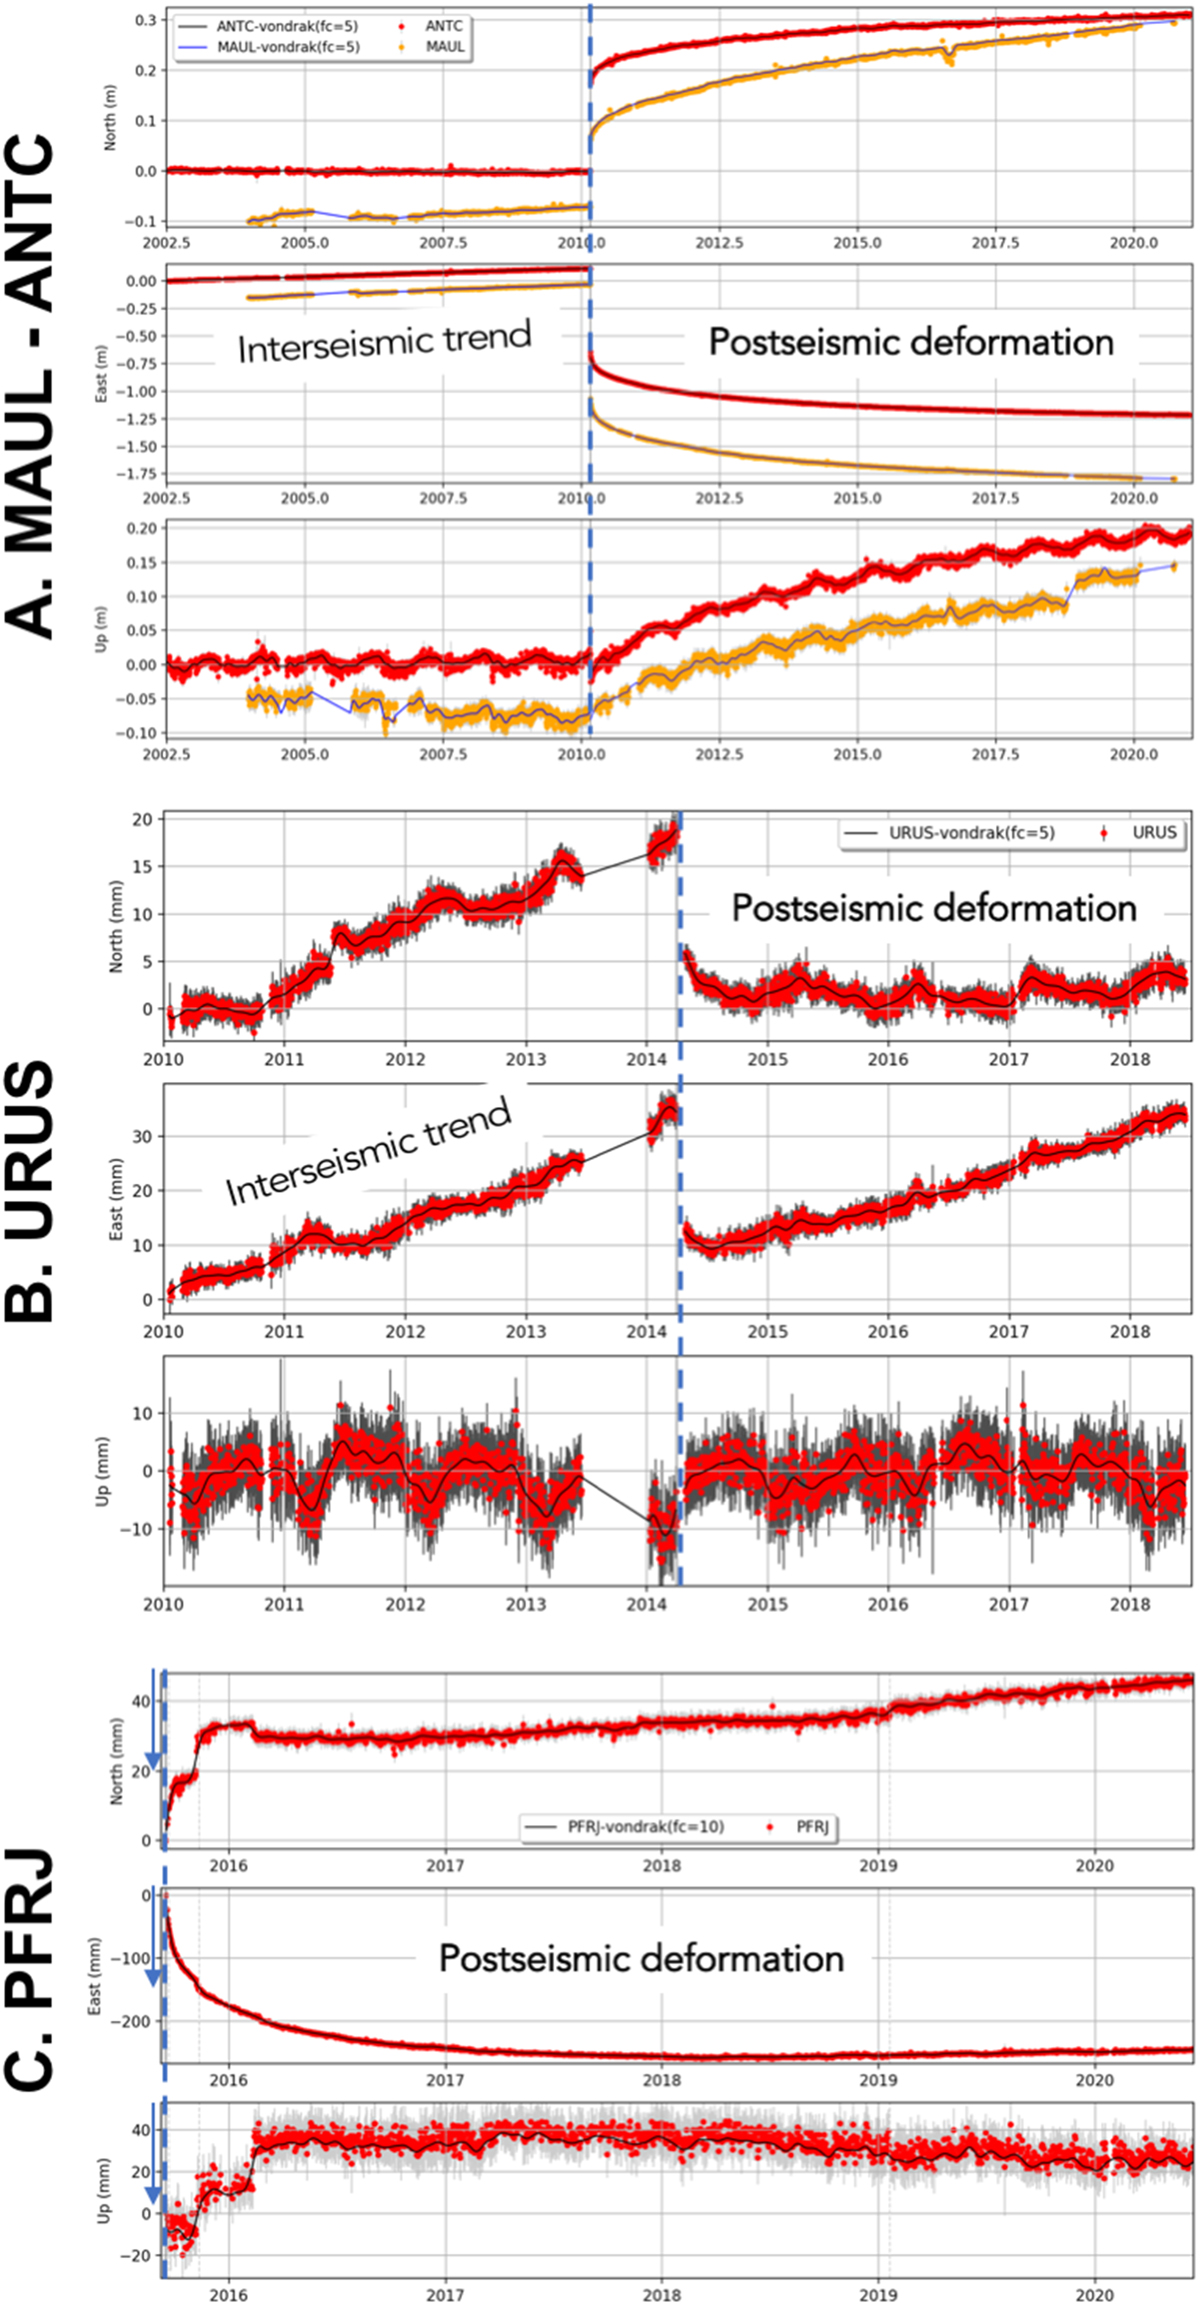
Fig. 8
Download original image
Surface deformation associated with seismic cycle. North-East-Up components of time series from our processing at different stations: (A) ANTC (red) and MAUL (orange), in Chile, located at the foothill of the Andes in the region affected by the 2010 Maule earthquake; (B) URUS in Bolivia, in far field of the 2014 Iquique earthquake; (C) PFRJ in Chile, located on the coastline in near field of the 2015 Illapel earthquake. For (C), since we show only the postseismic period, the blue arrows depict the direction of the coseismic displacements. All time series are represented relative to stable South America. All time series are highlighted by Vondrak filters, which cutoff frequencies in cycle per year are indicated in figures insets (dark full lines). Location of stations are depicted in Figure 1.
Current usage metrics show cumulative count of Article Views (full-text article views including HTML views, PDF and ePub downloads, according to the available data) and Abstracts Views on Vision4Press platform.
Data correspond to usage on the plateform after 2015. The current usage metrics is available 48-96 hours after online publication and is updated daily on week days.
Initial download of the metrics may take a while.