")
")
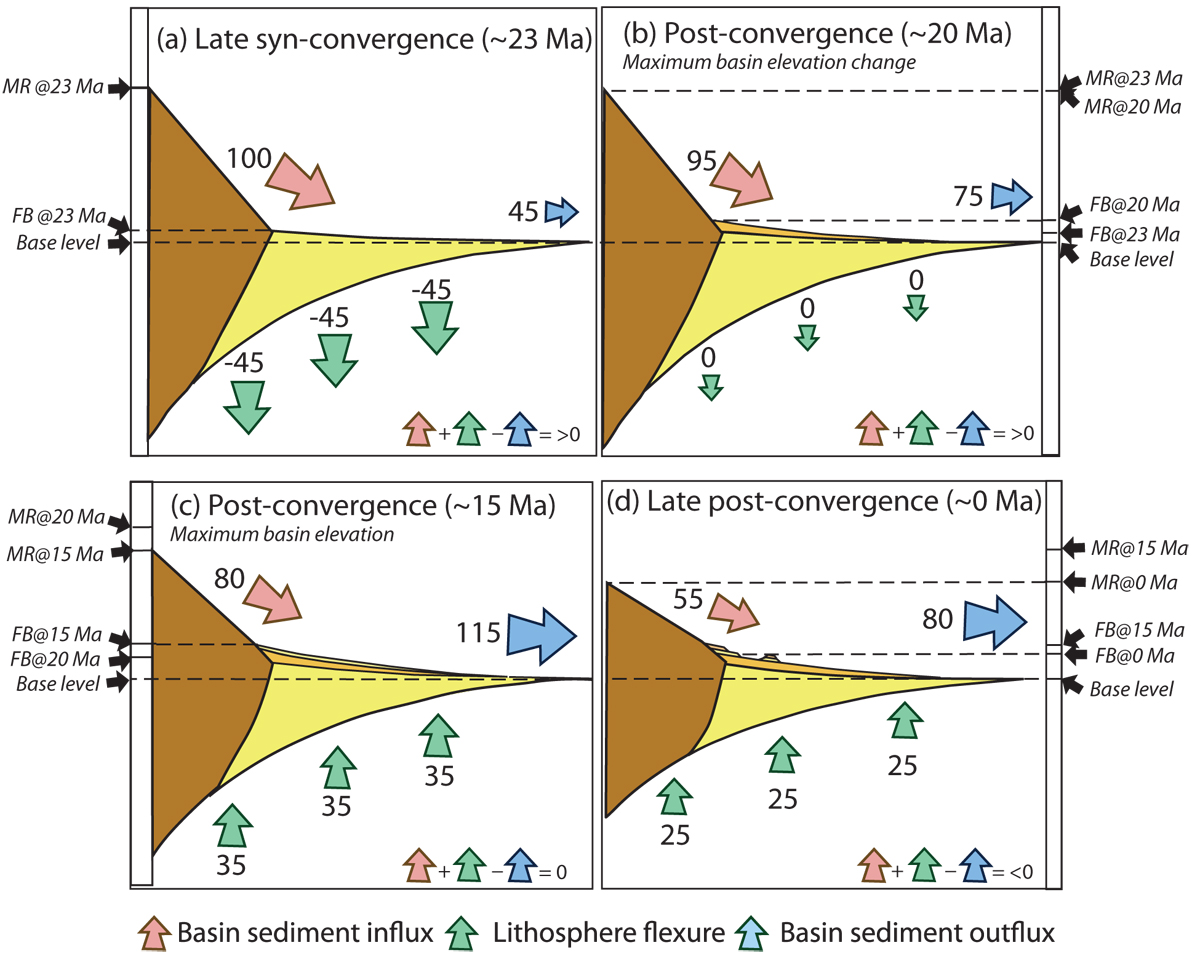
Fig. 11
Download original image
Schematic representation of results of numerical modelling of Bernard et al. (2020) simulating the transition from syn-convergence to post-convergence in four time frames, designed to represent the sedimentation and erosion record along the North Pyrenean thrust front from early Miocene to present day. Red, green and blue arrows correspond respectively to three controlling parameters, the basin influx from the orogen, lithospheric flexure (positive is uplift, negative is subsidence) and basin outflux. Numbers next to arrows indicate a percentage contribution to the basin elevation based on model results detailed in Bernard et al. (2020). The sum of these values (see inset on each cartoon) results in an increase in elevation of the foreland basin in (a) and (b), stasis in (c), and erosion leading to a decrease in elevation in (d). (a) Latest syn-orogenesis at ∼ 23 Ma (end of plate convergence). (b) Early post-orogenesis at ∼ 20 Ma when positive elevation change of the foreland basin is maximum. (c) Post-orogenesis at ∼ 15 Ma when elevation of the foreland basin is maximum. (d) Post-orogenesis at ∼ 0 Ma when elevation of both the range and foreland basin are decreasing. Black arrows indicate elevation of the mountain range (MR) and foreland basin (FB) for the specific time frame and for the previous step for comparison. Adapted from Bernard et al. (2020).
Current usage metrics show cumulative count of Article Views (full-text article views including HTML views, PDF and ePub downloads, according to the available data) and Abstracts Views on Vision4Press platform.
Data correspond to usage on the plateform after 2015. The current usage metrics is available 48-96 hours after online publication and is updated daily on week days.
Initial download of the metrics may take a while.