")
")
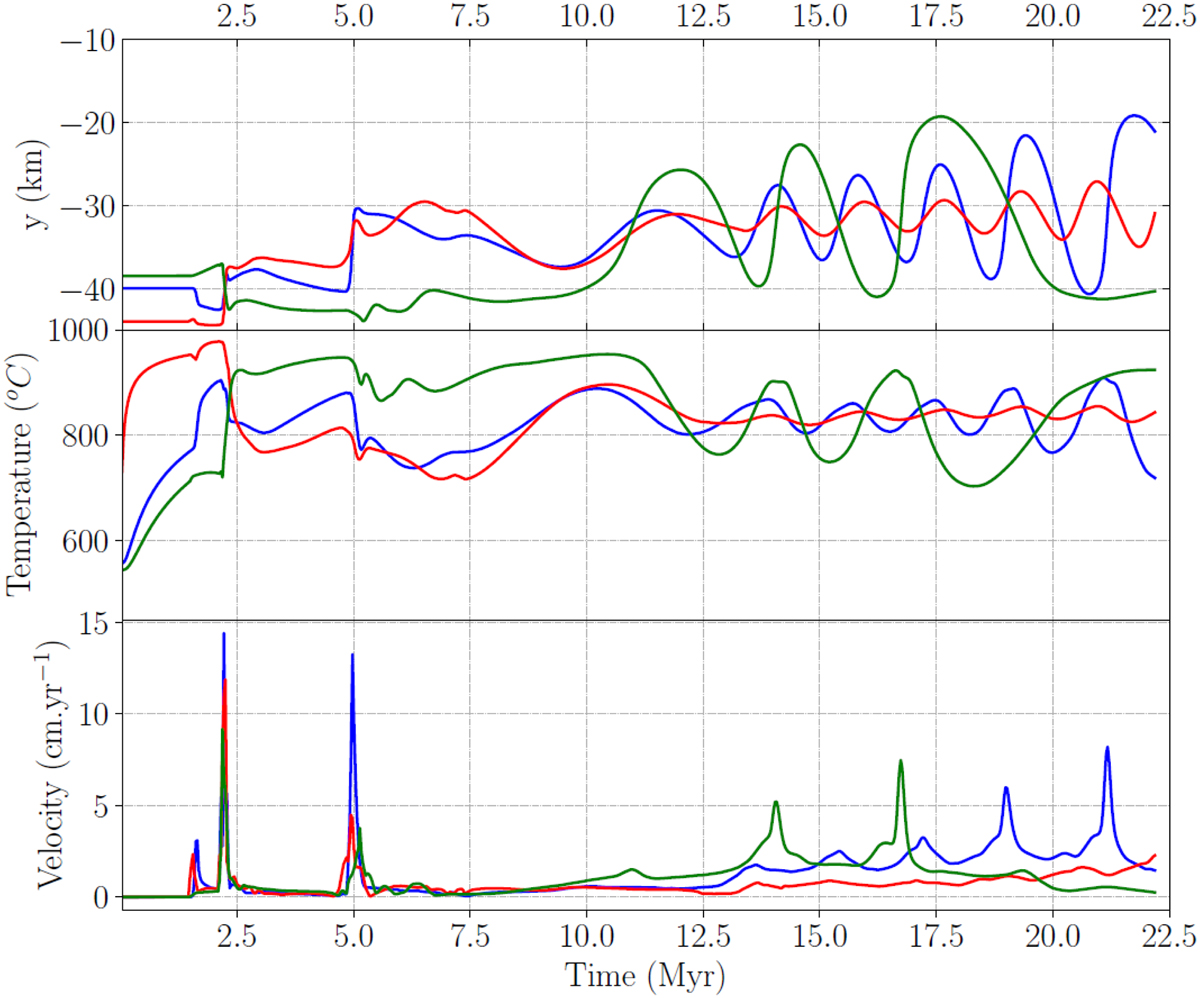
Fig. 4
Download original image
Modeled displacement (top), thermal evolution (middle) and velocity (bottom) of three material points, located initially at depths equal to −44 km (red), −40 km (blue), and −38 km (green), during the evolution of the 3D numerical experiment. The first accelerated motion is recorded after ca. 2 Myr of heating and corresponds to downward motion of the blue marker, concomitant with upward motion of the green marker, which corresponds to the onset of the buoyancy-driven segregation. Just before 2.5 Myr, the onset of composition-driven diapirism is marked by rapid motion of all markers, some going up (red and blue points), and others going down (green) at a velocity up to 15 cm/yr. A second rapid, gravitational destabilization of the layers occurs at 5 Myr. From this time onward, the three markers record cycles of temperature increase and decrease from 650 to 900 °C with a period of 1 to 3 Myr, and at a velocity of 1 to 7 cm/yr.
Current usage metrics show cumulative count of Article Views (full-text article views including HTML views, PDF and ePub downloads, according to the available data) and Abstracts Views on Vision4Press platform.
Data correspond to usage on the plateform after 2015. The current usage metrics is available 48-96 hours after online publication and is updated daily on week days.
Initial download of the metrics may take a while.