")
")
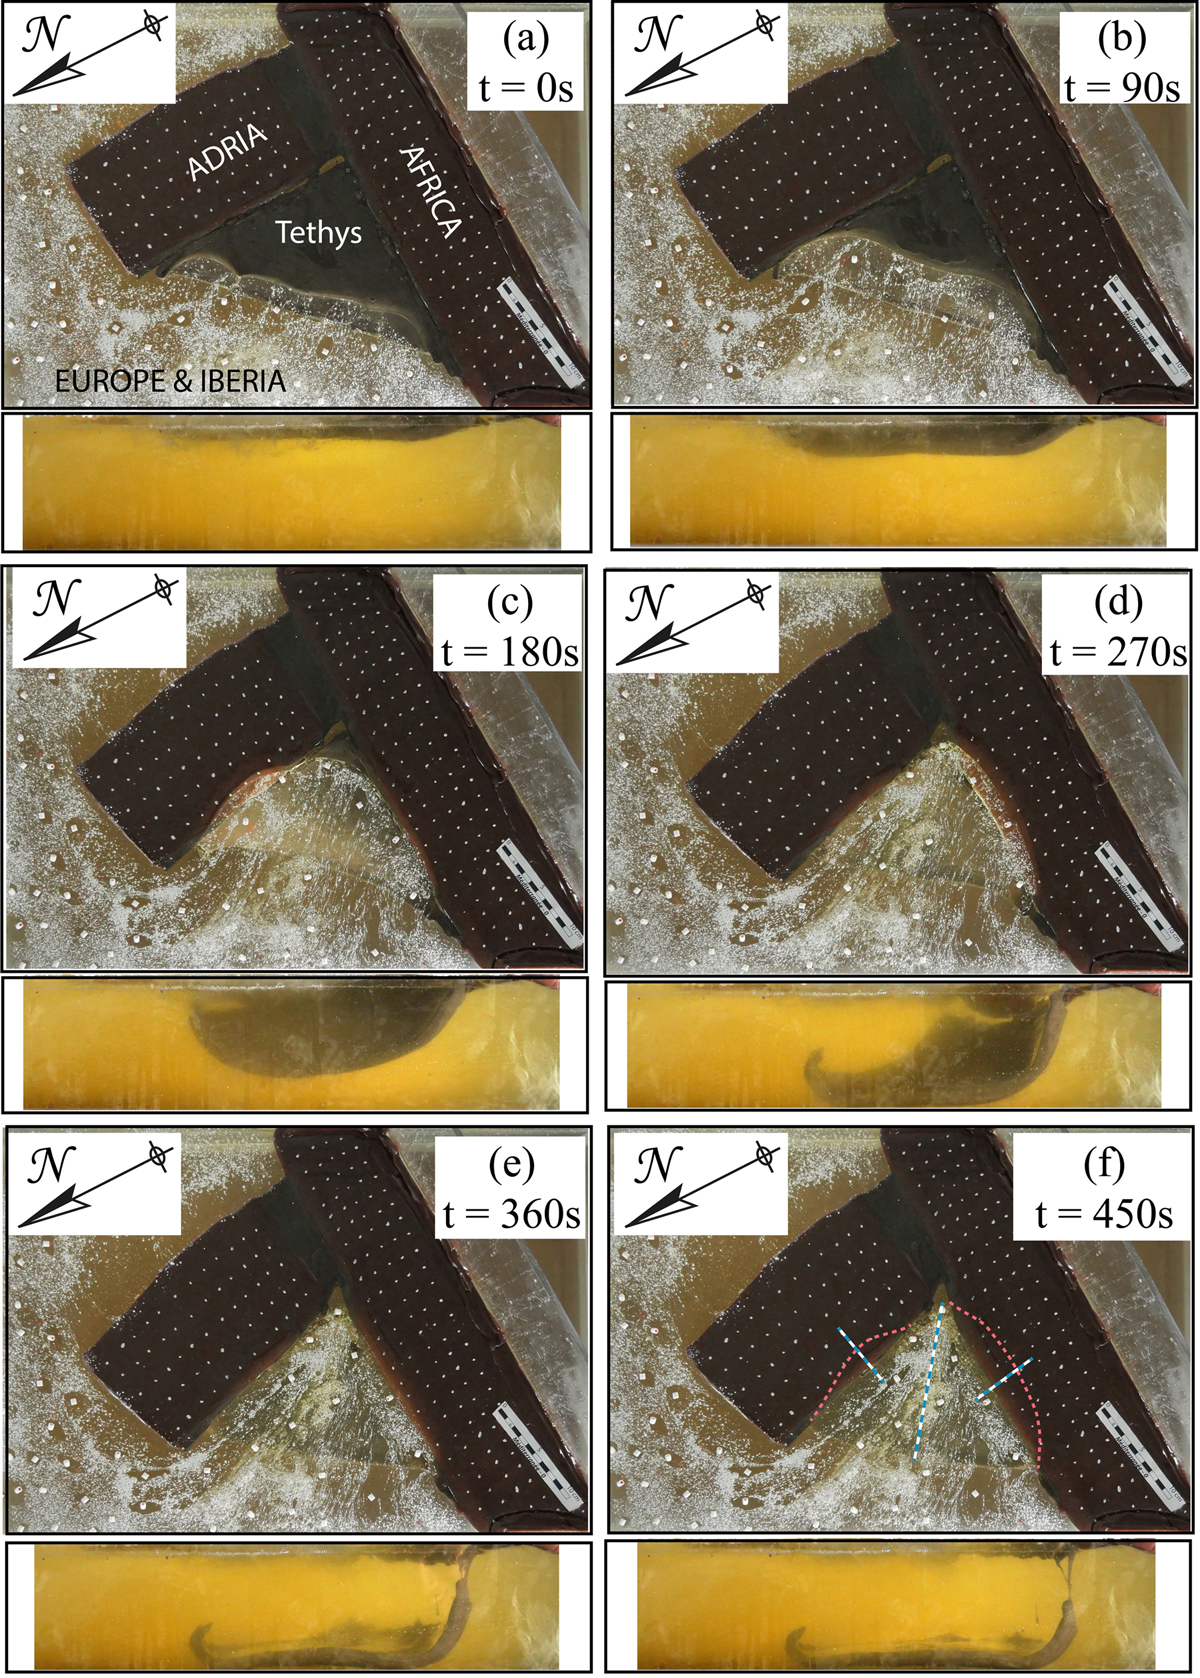
Fig. 5
Download original image
Top and lateral views of Model 3. Slab break-off occurs between 160 s (margin of northern Adria) and 300 s (margin of western Africa). The red dotted-line in (f) shows the boundary of the continental domain that first subducted and then came back to the surface following break-off, and the white-blue dotted lines show the position of the cross-sections along which subduction lengths presented in Figure 6a are measured.
Current usage metrics show cumulative count of Article Views (full-text article views including HTML views, PDF and ePub downloads, according to the available data) and Abstracts Views on Vision4Press platform.
Data correspond to usage on the plateform after 2015. The current usage metrics is available 48-96 hours after online publication and is updated daily on week days.
Initial download of the metrics may take a while.