")
")
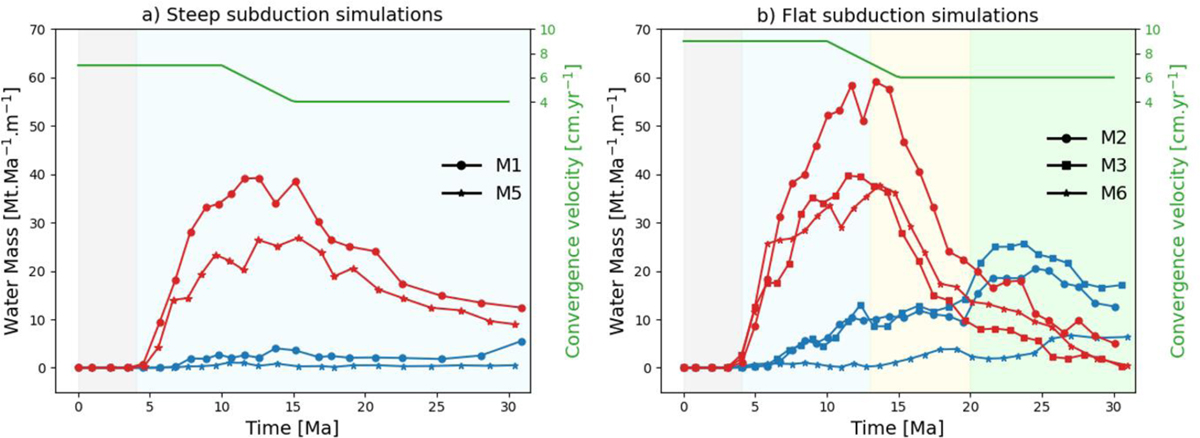
Fig. 4
Download original image
Amount of water utilized in mantle hydration vs melting in steep subduction simulations (left, M1 and M5) and flat-slab simulations (right, M2, M3, M6). The green curve represents the convergence rate. The red curve illustrates the amount of water consumed during melting processes, while the blue curve shows the amount of water consumed by mantle hydration. The different background colors represent the different stages of flat subduction simulations: Gray area) Initiation of subduction; Blue area) The dip angle is still relatively high and only mantle melting is observed; Yellow area) Initiation of flat subduction and onset of oceanic crust melting; Green area) Flat subduction is established: the slab lies beneath the continental lithosphere.
Current usage metrics show cumulative count of Article Views (full-text article views including HTML views, PDF and ePub downloads, according to the available data) and Abstracts Views on Vision4Press platform.
Data correspond to usage on the plateform after 2015. The current usage metrics is available 48-96 hours after online publication and is updated daily on week days.
Initial download of the metrics may take a while.