


Fig. 18
Download original image
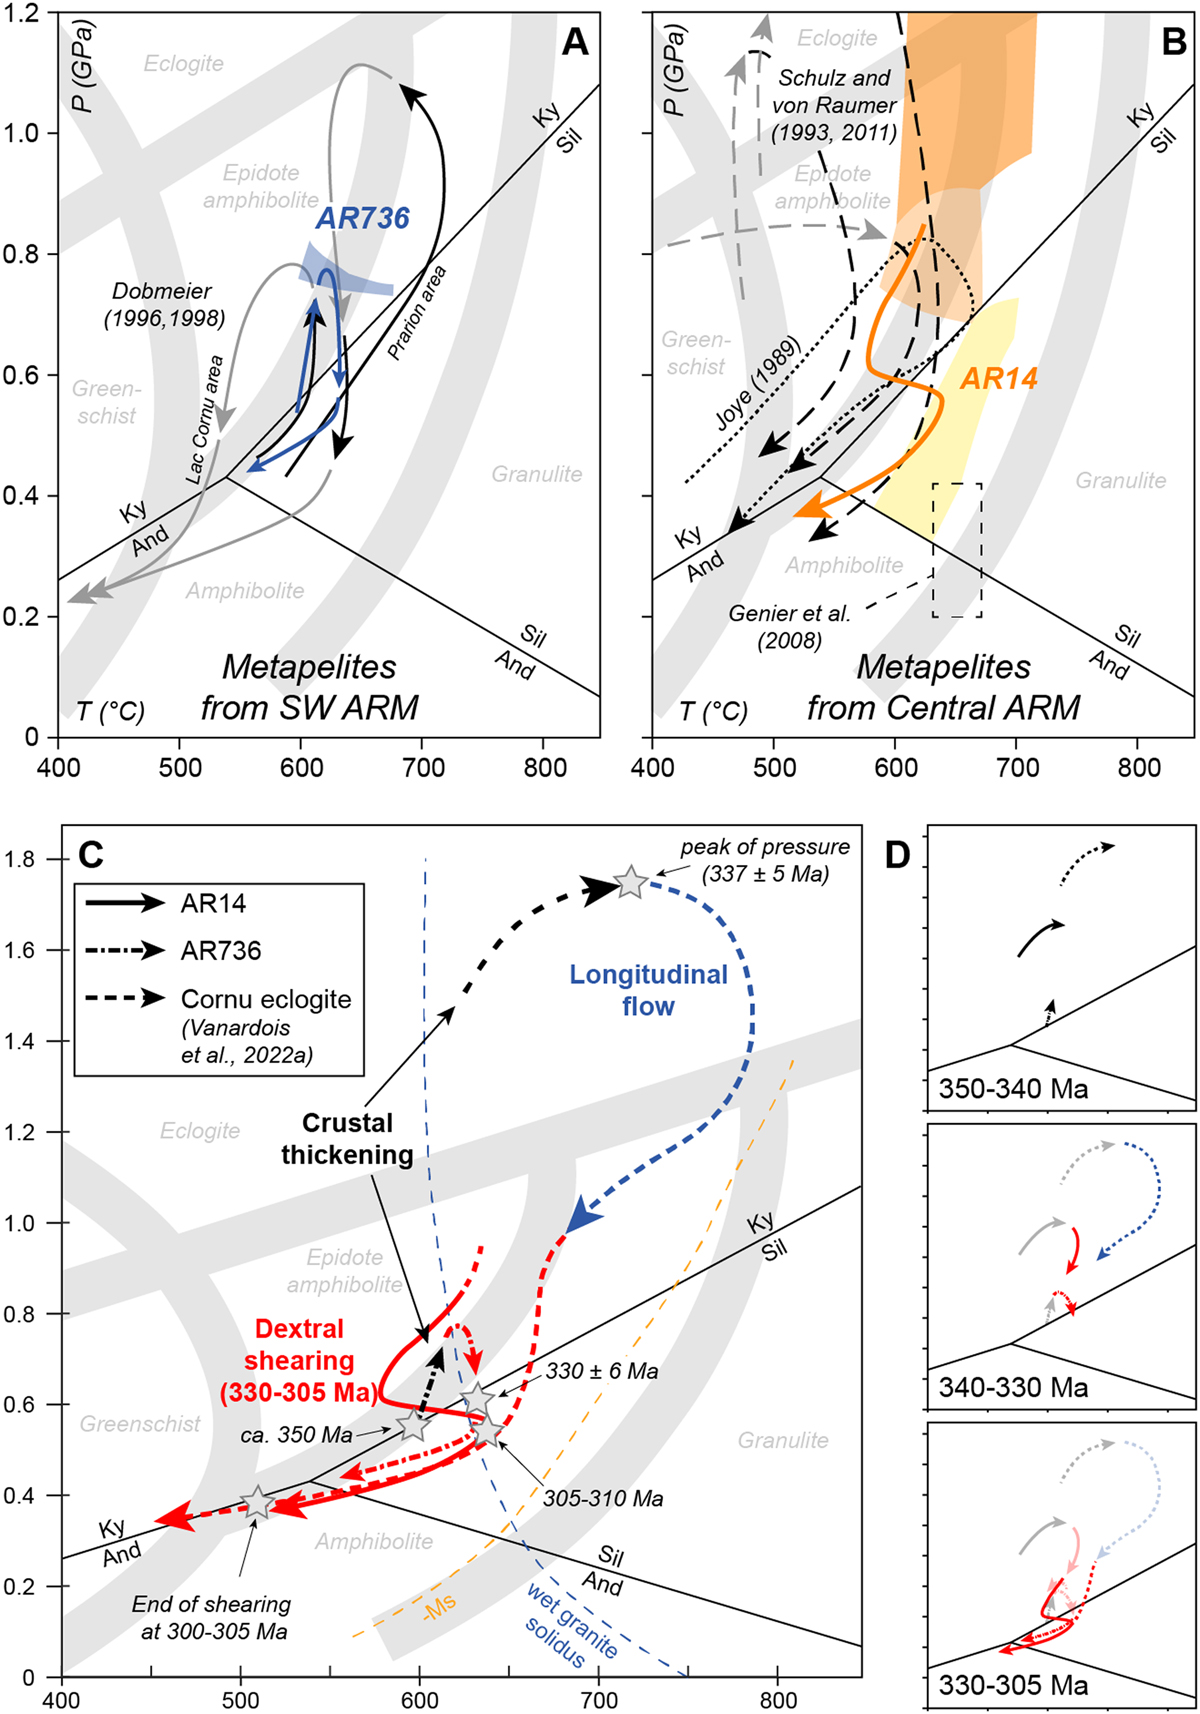
Comparison of the P–T paths with previously published data. (A and B) Comparison of our P–T paths with the ones published in the southwestern and central parts of the ARM. Same references than in Figure 1. (C) Comparison of P–T–t–D paths of this study (thick arrows) and lower crust eclogites (Vanardois et al., 2022a). Grey stars indicate timing constraints on the P–T–D paths. (D) Temporal evolutions of the three P–T paths: 350-340 Ma: crustal thickening; 340-330 Ma: longitudinal flow in partially molten lower crust and beginning of dextral transpression in the middle crust; 330-305 Ma: juxtaposition and exhumation of upper and lower crusts by the dextral shear zones.
Current usage metrics show cumulative count of Article Views (full-text article views including HTML views, PDF and ePub downloads, according to the available data) and Abstracts Views on Vision4Press platform.
Data correspond to usage on the plateform after 2015. The current usage metrics is available 48-96 hours after online publication and is updated daily on week days.
Initial download of the metrics may take a while.