")
")
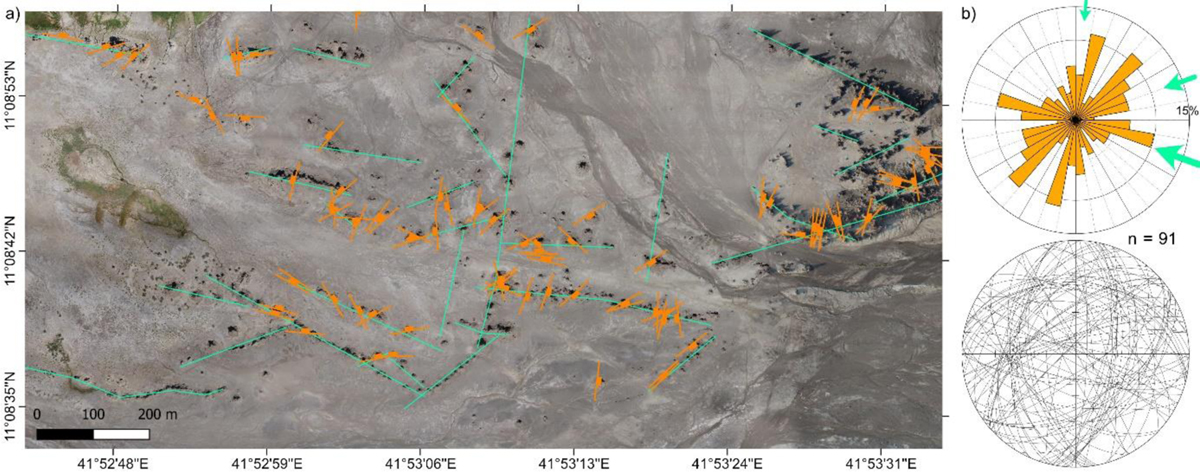
Fig. 8
Download original image
a) Location map of hydrothermal chimney crosscutting planar structures measured in the SHCa, represented as oriented orange symbols (satellite image from ©2022 Google Earth). Green lines correspond to 1/10,000 scale hydrothermal chimney alignment mapped over the LAGF area. Map location is shown in Figure 4. b) Rose diagram and stereographic projection represent overall measurements of the hydrothermal chimney crosscutting planar structures. The different sized green arrows indicate the main directions of chimney alignments by relative importance (cf. Fig. 4c).
Current usage metrics show cumulative count of Article Views (full-text article views including HTML views, PDF and ePub downloads, according to the available data) and Abstracts Views on Vision4Press platform.
Data correspond to usage on the plateform after 2015. The current usage metrics is available 48-96 hours after online publication and is updated daily on week days.
Initial download of the metrics may take a while.