")
")
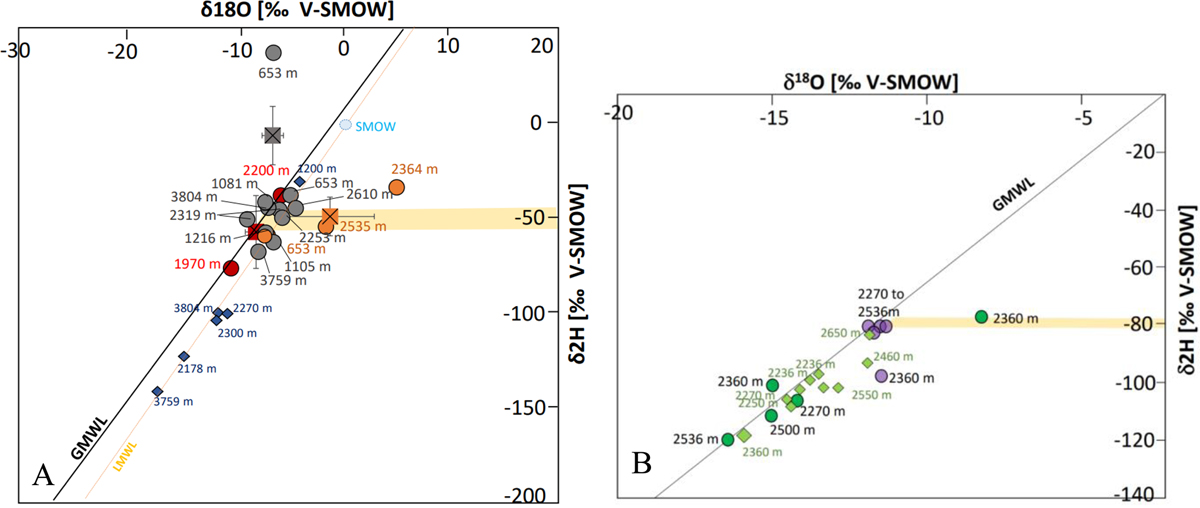
Fig. 4
Download original image
A- Plot of the δ18O vs δ2H values of the FIs from the MBM, grey dots = vertical veins, red dots = horizontal veins, orange dots = syntectonic veins. The average values of the FIs for each veins family are represented by grey, red and yellow squares respectively. The number near the symbols refer to the altitude of the meteoric water samples and the quartz veins. Blue diamonds = compositions of meteoric waters sampled at the same elevation as the quartz veins. The δ2H values acquired by the traditional approach upon crushing are shown in the yellow area. The data are plotted with the meteoric water line for the Northern Hemisphere (GMWL) and the local metoric water (LMWL). B- Plot of the δ18O vs δ2H values of the FIs from the CM, Vertical veins are shown in green, the average value of the FIs is represented by a green square. The six veins analyzed using the conventional method are shown with purple dots. The 5 veins analyzed using the new method are represented with green dots. The δ2H values acquired by the traditional approach upon crushing are shown in the yellow area. The data are plotted with the meteoric water line for the Northern Hemisphere.
A-Valeurs du δ18O et du δ2H des IFs du MBM. Les veines verticales sont représentées en gris, les veines horizontales en rouge et les veines syntectoniques en orange. Les valeurs moyennes de la composition des IFs pour chaque famille de veines sont représentées par des carrés gris, rouges et jaunes respectivement. Les données sont repontées avec la droite des eaux météoriques pour l’hémisphère Nord (GMWL) et la droite des eaux météoriques locales (LMWL), les nombres à coté des symboles indiquen l’altitude de prélèvements des eaux météoriques ou des veines de quartz La zone jaune représente les valeurs du δ2H obtenues par la méthode conventionnelle apres écrasement. B- Valeurs δ18O vs δ2H des IFs du CM, les veines verticales sont représentées en vert, la valeur moyenne des IFs est représentée par un carré vert. Les six veines analysées avec la méthode conventionelle sont représentées en violet. Les données sont reportées avec la droite des eaux météoriquex pour l'hémisphère Nord. La zone jaune représente les valeurs du δ2H obtenues par la méthode conventionnelle apres écrasement.
Current usage metrics show cumulative count of Article Views (full-text article views including HTML views, PDF and ePub downloads, according to the available data) and Abstracts Views on Vision4Press platform.
Data correspond to usage on the plateform after 2015. The current usage metrics is available 48-96 hours after online publication and is updated daily on week days.
Initial download of the metrics may take a while.