")
")
Open Access
Fig. 11
Download original image
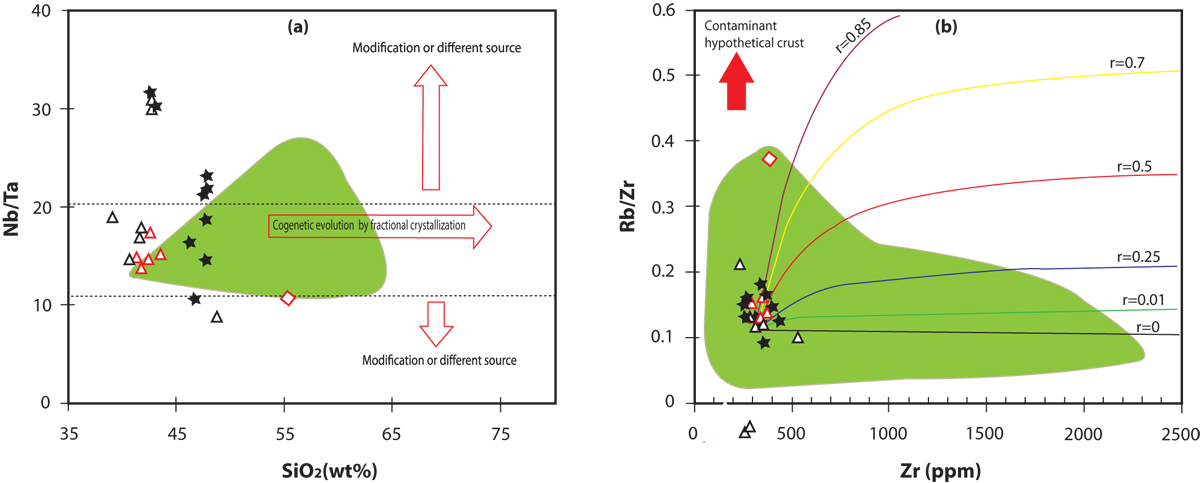
Plot of Bini Warack lavas in (a) the Nb/Ta versus SiO2 diagram illustrating the narrow variation of Nb/Ta ratios for most samples; (b) AFC Rb/Zr versus Zr modeled diagram. The green field represents CVL lavas (Asaah et al., 2015b). The legend is the same as in the previous figure.
Current usage metrics show cumulative count of Article Views (full-text article views including HTML views, PDF and ePub downloads, according to the available data) and Abstracts Views on Vision4Press platform.
Data correspond to usage on the plateform after 2015. The current usage metrics is available 48-96 hours after online publication and is updated daily on week days.
Initial download of the metrics may take a while.