")
")
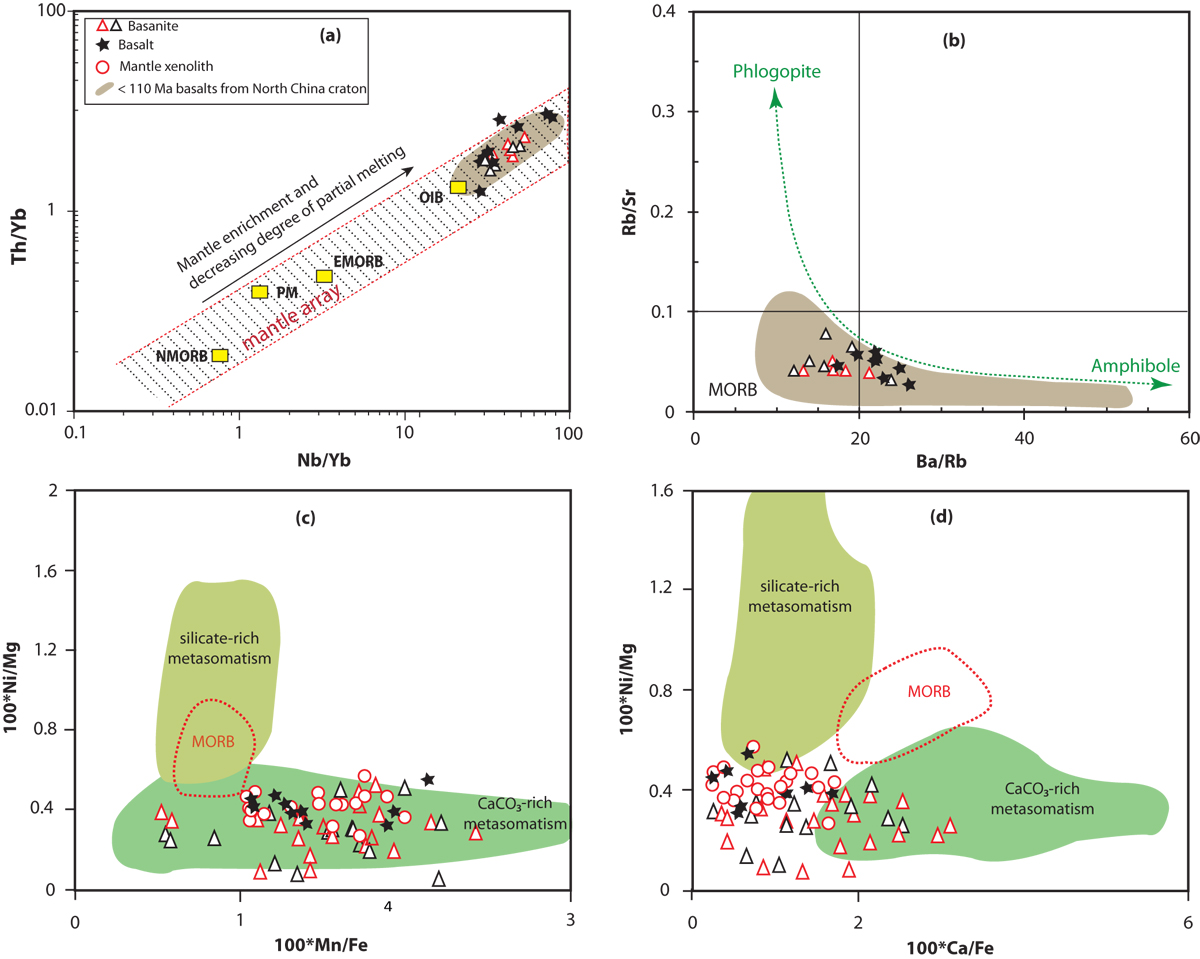
Fig. 12
Download original image
Plots of bulk rock (a) Th/Yb versus Nb/Yb, (b) Rb/Sr versus Ba/Rb, (c) olivines 100*Mn/Fe versus 100*Ni/Mg, and (d) 100*Ca/Fe versus 100*Ni/Mg. The mantle array in panel (a) is defined by oceanic basaltic rocks, and the vertical black arrows indicate the effect of crustal melt input in the source of basaltic rocks (Pearce, 2008). In panel (b), the arrows showing partial melts from amphibole- and phlogopite-bearing mantle sources are adopted from Furman and Graham (1999). The compositions of MORB are taken from Gale et al. (2013). The olivine data for MORB are from Sobolev et al. (2007).
Current usage metrics show cumulative count of Article Views (full-text article views including HTML views, PDF and ePub downloads, according to the available data) and Abstracts Views on Vision4Press platform.
Data correspond to usage on the plateform after 2015. The current usage metrics is available 48-96 hours after online publication and is updated daily on week days.
Initial download of the metrics may take a while.