")
")
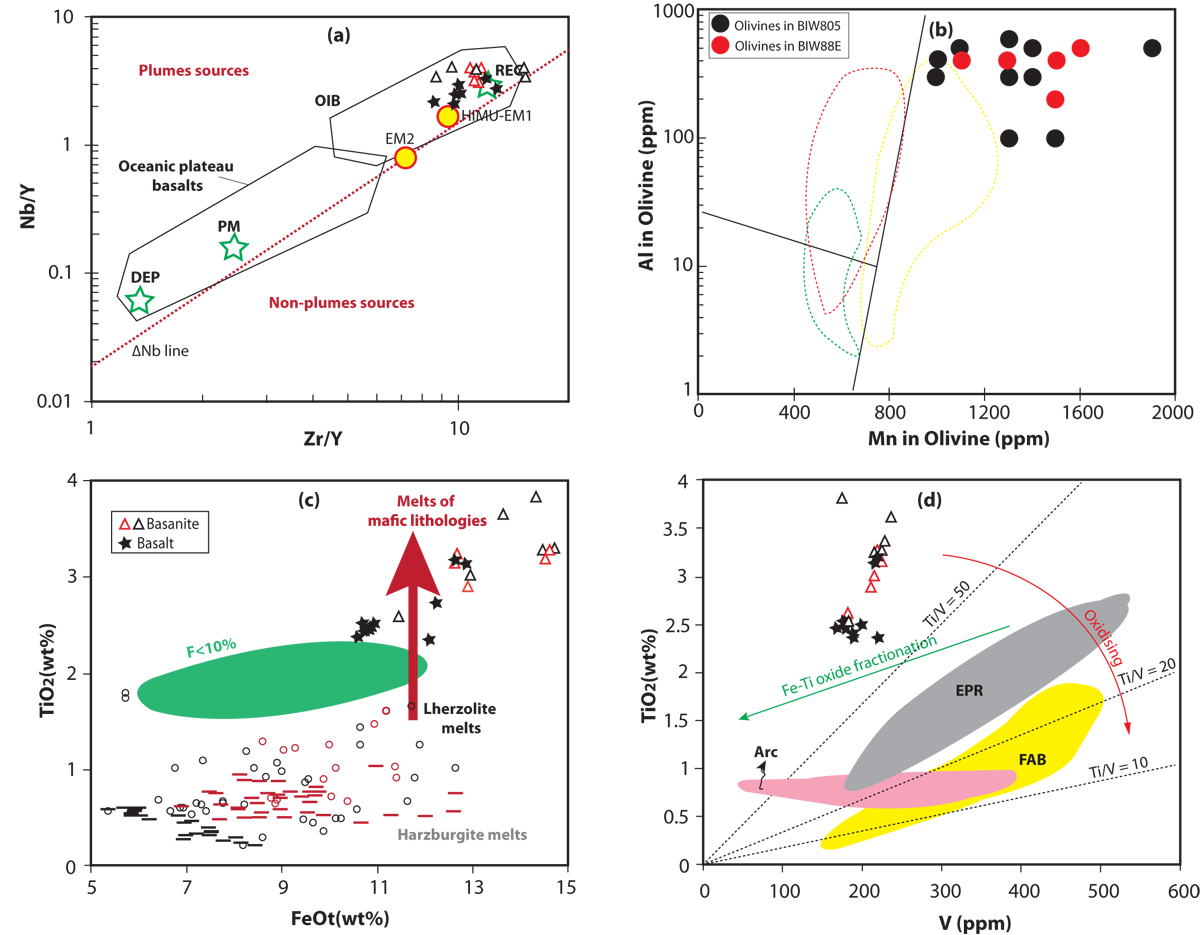
Fig. 9
Download original image
(a) Plot of the host lavas relative to various mantle compositional components (green star) and fields for basalts from different tectonic settings as defined by Weaver (1991) and Condie (2005); (b) Plot of Al versus Mn for the olivine xenocrysts; (c) Comparison of Bini Warack basanites and basalts with experimental melts of representative mantle lithologies using their TiO2 and FeOt contents; (d) TiO2 versus V plot of Bini basanites and basalts. In panel (a), DEP, deep depleted mantle; EM1, enriched mantle sources; HIMU, high U/Pb mantle source; OIB, oceanic island basalt; PM, primitive mantle; REC, recycled component. In panel (b), the fields of spinel–garnet lherzolite (dashed green line), garnet–lherzolite (dashed red line), and spinel–lherzolite (yellow line) are after Yuan and Yan (2022). The green ellipse in panel (c) denotes the low-degree (<10%) experimental melts of fertile lherzolite. The black circles illustrate partial melts of fertile lherzolite, while the red ones highlight experimental melts formed at 1.5–2.5 GPa, just as the black dashes represent the composition of harzburgite partial melts and the red ones that of their experimental melt at 1.5–2.5 GPa. The thick red arrow schematically shows non-peridotite mantle rocks (e.g., amphibolite, silica-deficient, and silica-excess pyroxenites) typically with high TiO2 contents (≥2 wt%; Kushiro, 1996). Data for experimental melts of lherzolite and harzburgite are consistent with the compilation of Dai et al. (2023). In panel (d), the compositional zones for volcanic rocks from various tectonic settings and the magmatic differentiation trend caused by Fe–Ti oxide fractionation are from Reagan et al. (2010). FAB, fore-arc basalts; EPR, East Pacific Rise.
Current usage metrics show cumulative count of Article Views (full-text article views including HTML views, PDF and ePub downloads, according to the available data) and Abstracts Views on Vision4Press platform.
Data correspond to usage on the plateform after 2015. The current usage metrics is available 48-96 hours after online publication and is updated daily on week days.
Initial download of the metrics may take a while.