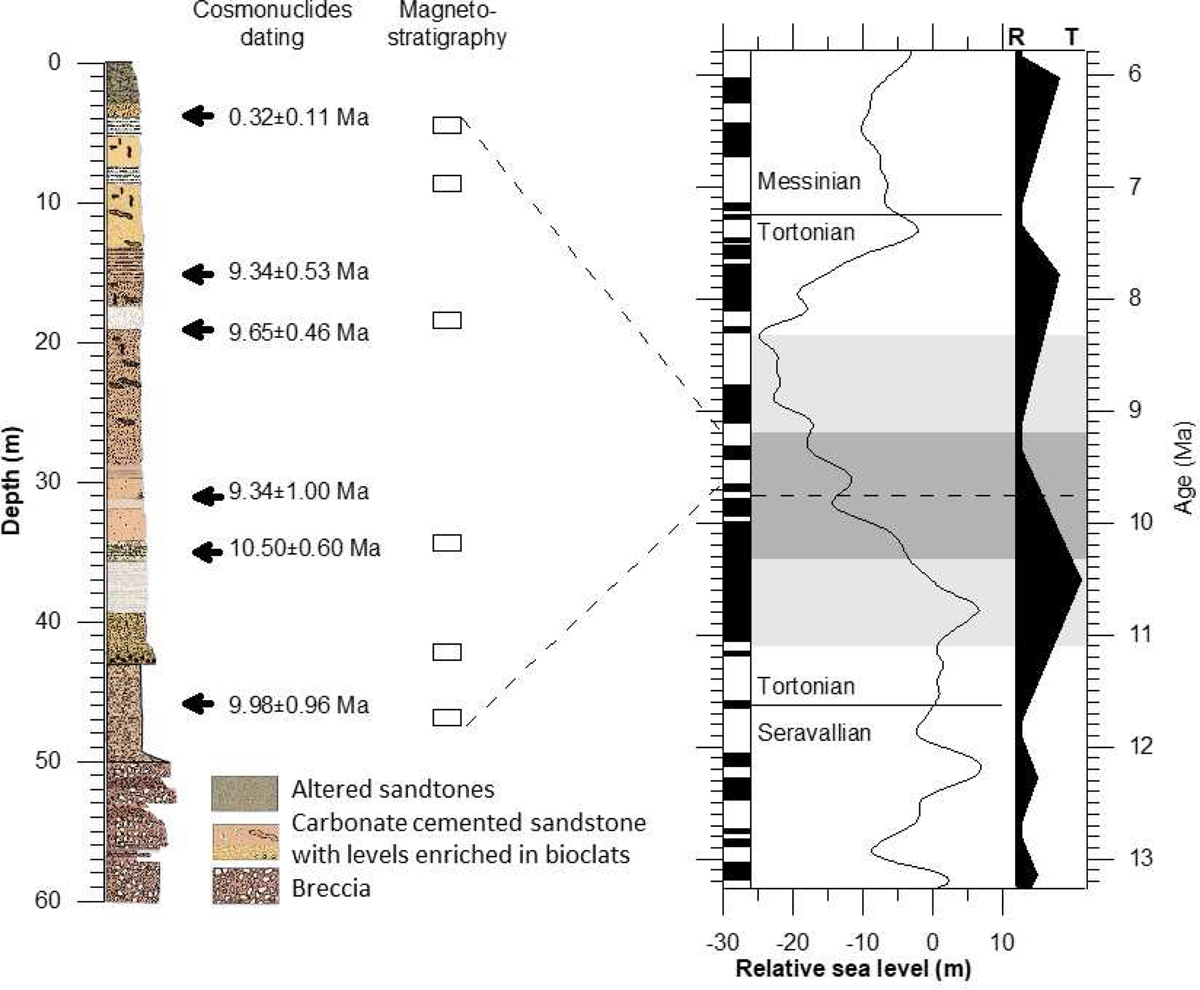
Fig. 6

Download original image
Log of core EOL101 with cosmonuclides dates and paleomagnetic data compared to the relative sea level at global scale (Miller et al., 2020) and to the regression-transgression megacycles (Hilgen et al., 2012) and the reference geomagnetic scale (Ogg, 2012). The light grey interval in this figure corresponds to the Min-Max error bars of cosmonuclides dating and the gray interval corresponds to the confidence level determined from kernel statistics.
Current usage metrics show cumulative count of Article Views (full-text article views including HTML views, PDF and ePub downloads, according to the available data) and Abstracts Views on Vision4Press platform.
Data correspond to usage on the plateform after 2015. The current usage metrics is available 48-96 hours after online publication and is updated daily on week days.
Initial download of the metrics may take a while.


