")
")
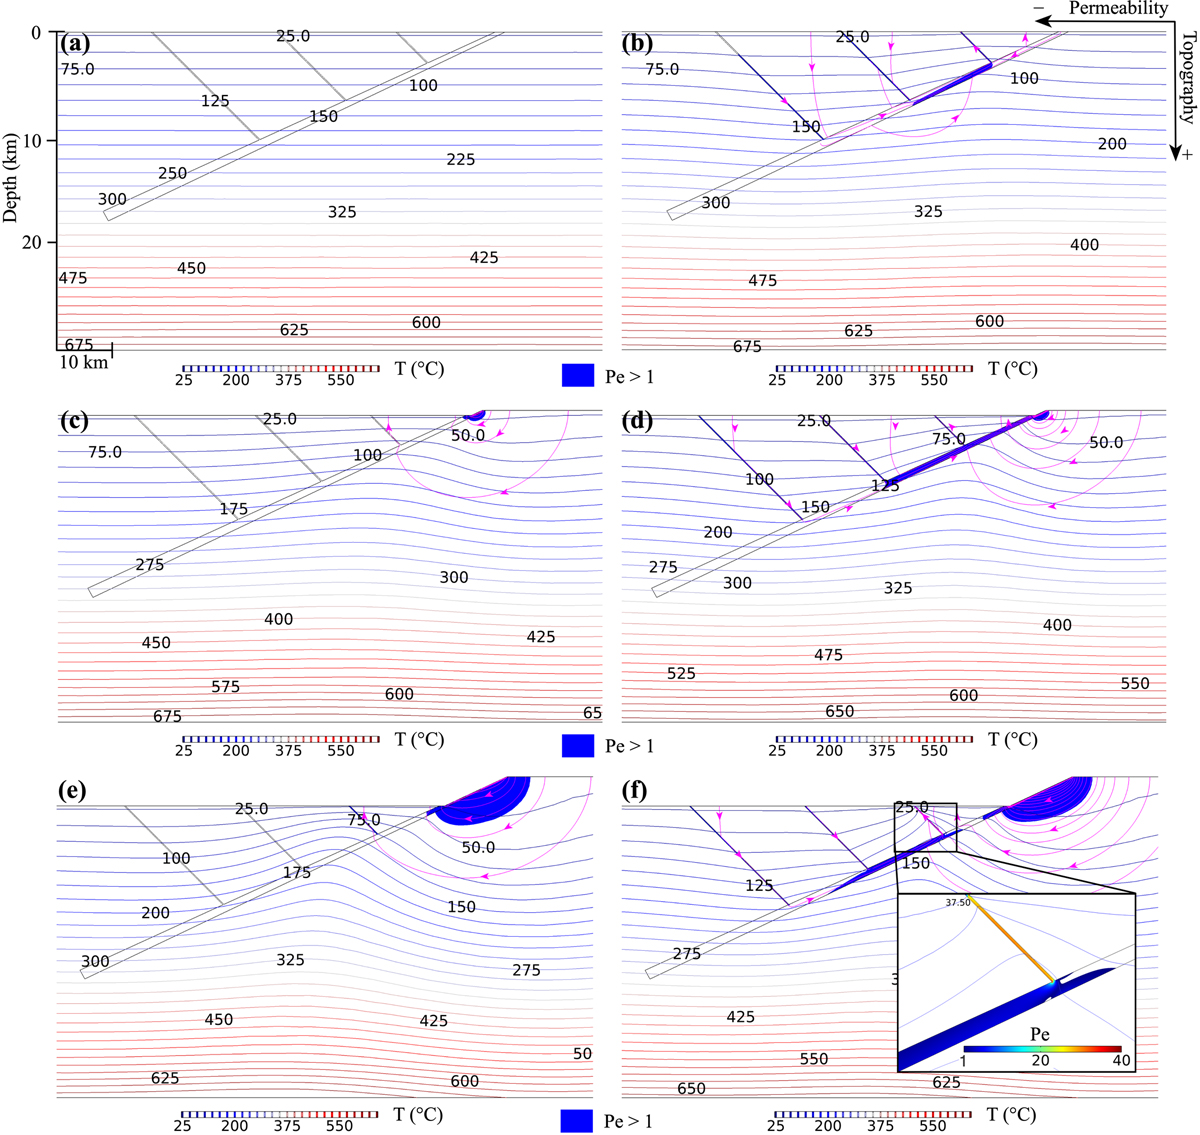
Fig. 5
Download original image
Experiments testing the topography effects on surface-derived fluid percolation within the detachment. The snapshots have been taken at the same moment (11.1 Myr). The Pe number greater than 1 (in blue) and isotherms (colored lines) and the major streamlines with arrowheads indicating the flow direction (in purple) are represented for the three tested topographies (0m, 500 m and 3000 m). The three diagrams on the left (a, c, e) correspond to the minimum permeability (Kd1) and those on the right (b, d, f) correspond to the maximum permeability (Kd4). Isotherms are indicated in °C.
Current usage metrics show cumulative count of Article Views (full-text article views including HTML views, PDF and ePub downloads, according to the available data) and Abstracts Views on Vision4Press platform.
Data correspond to usage on the plateform after 2015. The current usage metrics is available 48-96 hours after online publication and is updated daily on week days.
Initial download of the metrics may take a while.