Fig. 5

Download original image
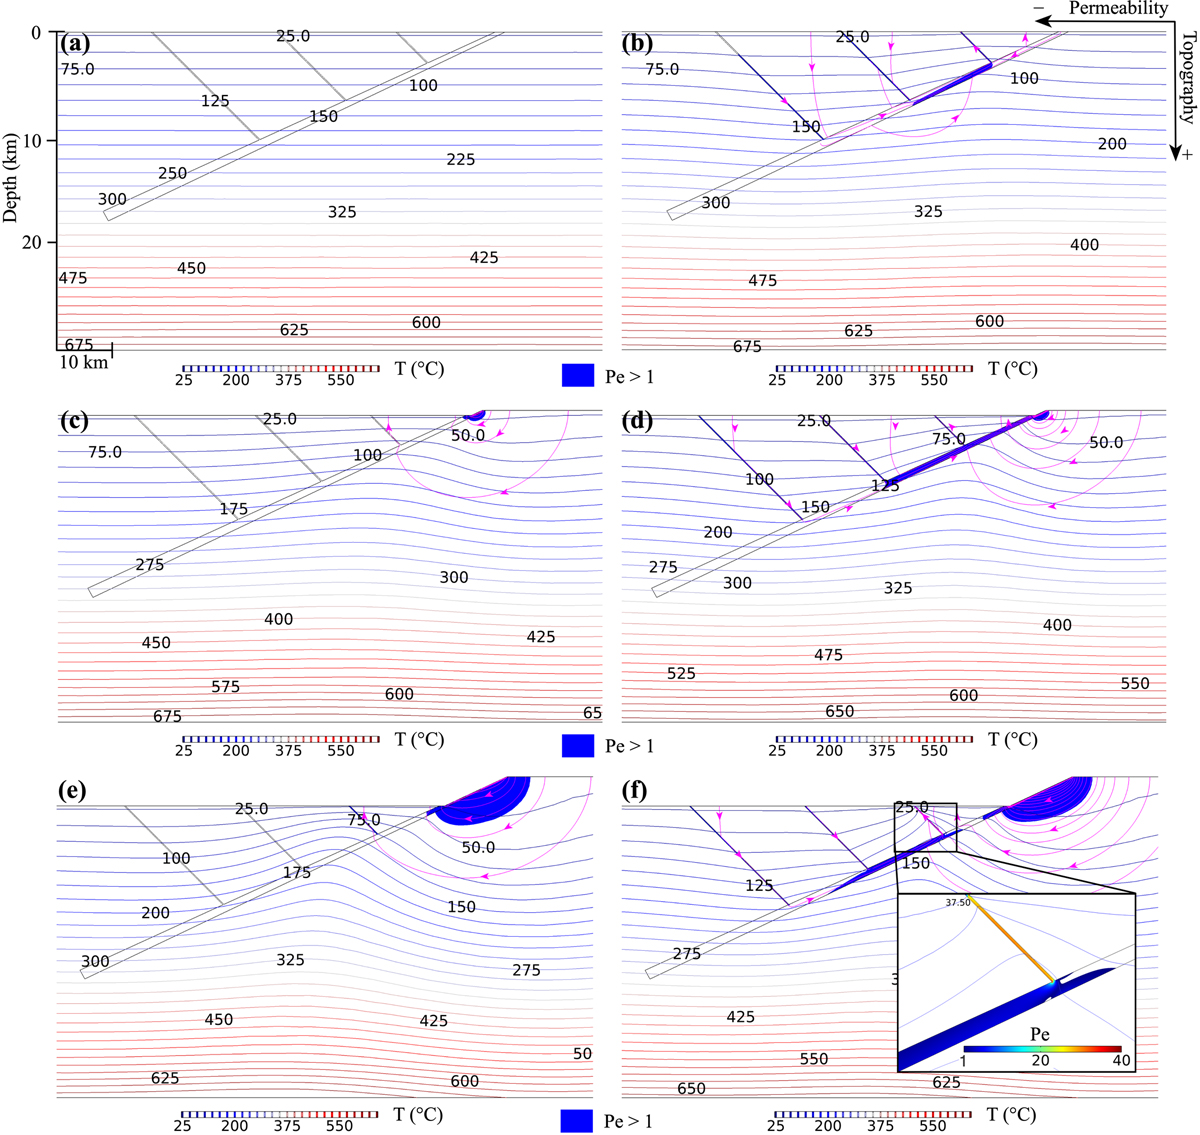
Experiments testing the topography effects on surface-derived fluid percolation within the detachment. The snapshots have been taken at the same moment (11.1 Myr). The Pe number greater than 1 (in blue) and isotherms (colored lines) and the major streamlines with arrowheads indicating the flow direction (in purple) are represented for the three tested topographies (0m, 500 m and 3000 m). The three diagrams on the left (a, c, e) correspond to the minimum permeability (Kd1) and those on the right (b, d, f) correspond to the maximum permeability (Kd4). Isotherms are indicated in °C.
Les statistiques affichées correspondent au cumul d'une part des vues des résumés de l'article et d'autre part des vues et téléchargements de l'article plein-texte (PDF, Full-HTML, ePub... selon les formats disponibles) sur la platefome Vision4Press.
Les statistiques sont disponibles avec un délai de 48 à 96 heures et sont mises à jour quotidiennement en semaine.
Le chargement des statistiques peut être long.


