")
")
Open Access
Fig. 4
Download original image
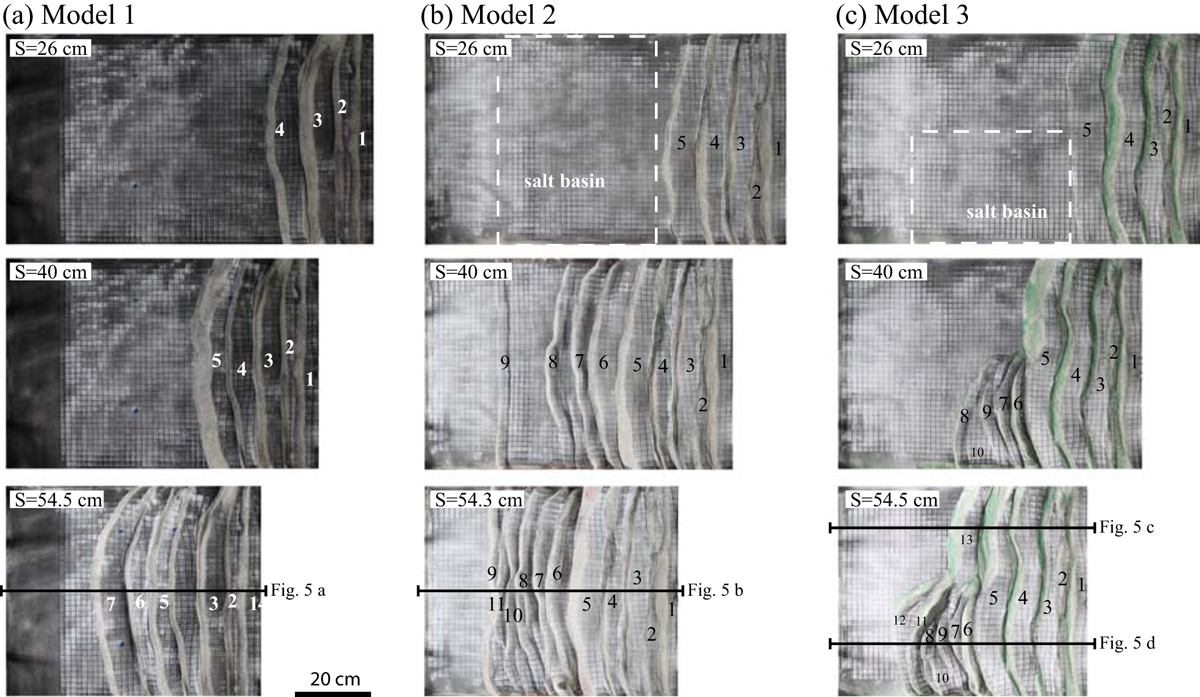
Overhead photographs of Models 1, 2 and 3 during deformation, all at the same scale. The area comprising a salt-analogue décollement is outlined by white dashed lines. Black lines indicate the location of the cross sections shown in Figure 5. "S" stands for "shortening".
Current usage metrics show cumulative count of Article Views (full-text article views including HTML views, PDF and ePub downloads, according to the available data) and Abstracts Views on Vision4Press platform.
Data correspond to usage on the plateform after 2015. The current usage metrics is available 48-96 hours after online publication and is updated daily on week days.
Initial download of the metrics may take a while.