")
")
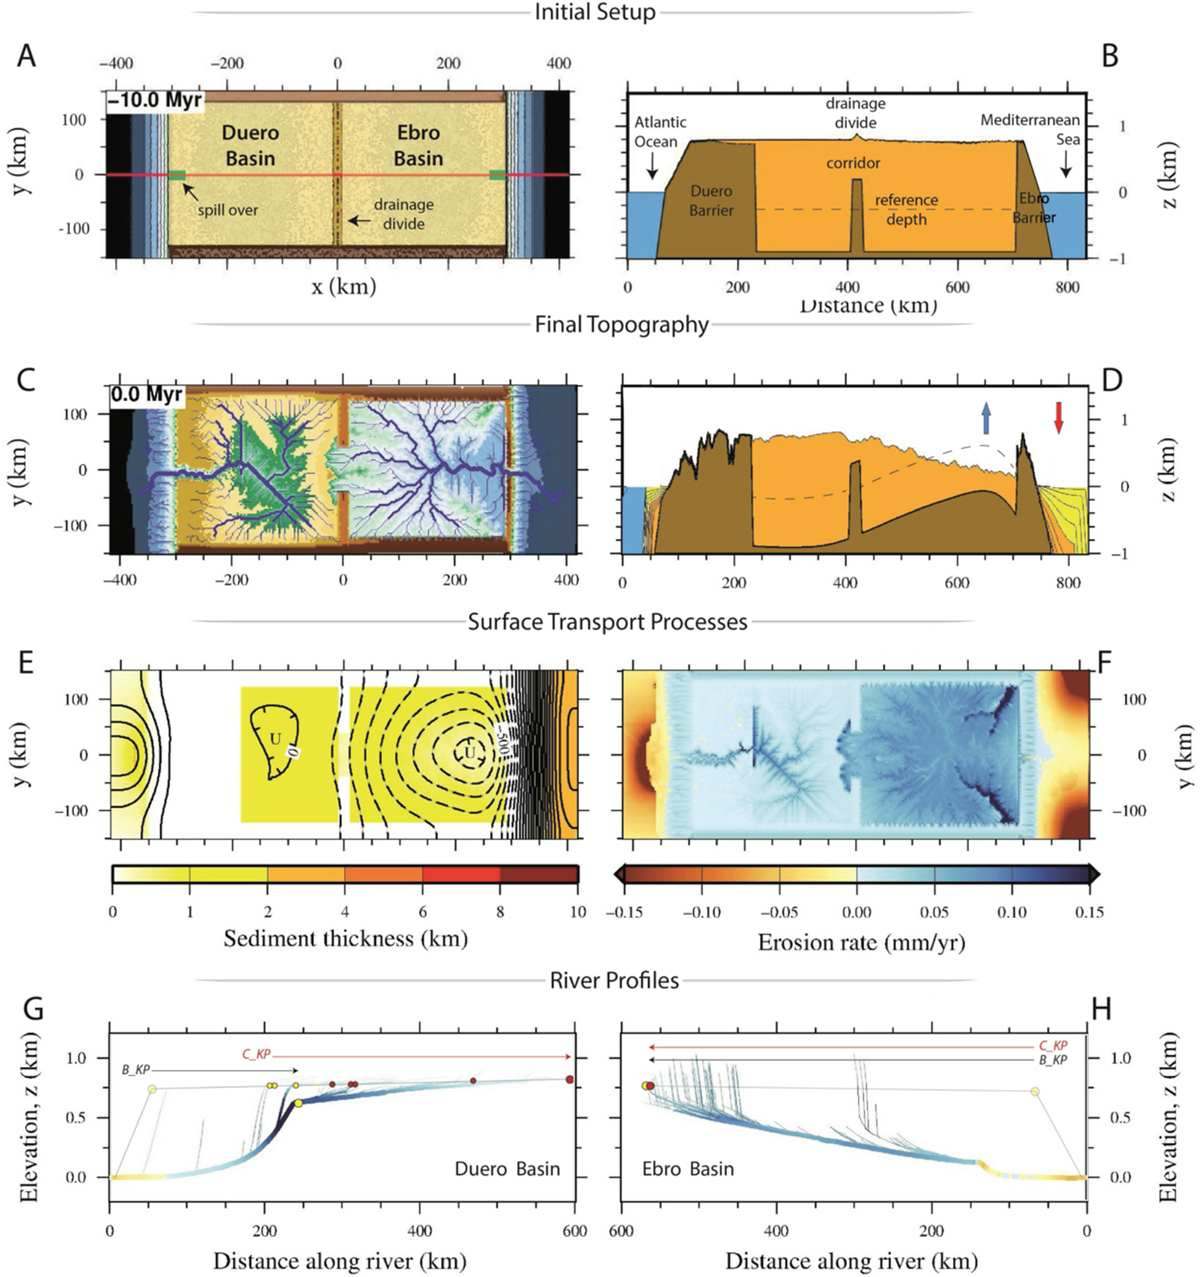
Fig. 3
Download original image
Reference model results. Panels (A) and (B) show the initial setup at t = −10 Myr. (C) Topography obtained at 0 Myr (present). (D) cross-section showing isostatic subsidence and rebound (dashed line and arrows). (E) Cumulative uplift (dashed) and subsidence (bold lines) and sediment thickness. (F) Sedimentation (−)/erosion (+) rates at t = 0. River profiles with knickpoint location for the Duero (G) and Ebro (H) river networks. The points displayed in these boxes indicate the location of bedrock (yellow, B_KP) and cover (red, C_KP) knickpoints (compare with Struth et al., 2019). Arrows indicate the distance traveled by the knickpoints from the initial location (yellow circle at x = 50 km).
Current usage metrics show cumulative count of Article Views (full-text article views including HTML views, PDF and ePub downloads, according to the available data) and Abstracts Views on Vision4Press platform.
Data correspond to usage on the plateform after 2015. The current usage metrics is available 48-96 hours after online publication and is updated daily on week days.
Initial download of the metrics may take a while.