Fig. 3

Download original image
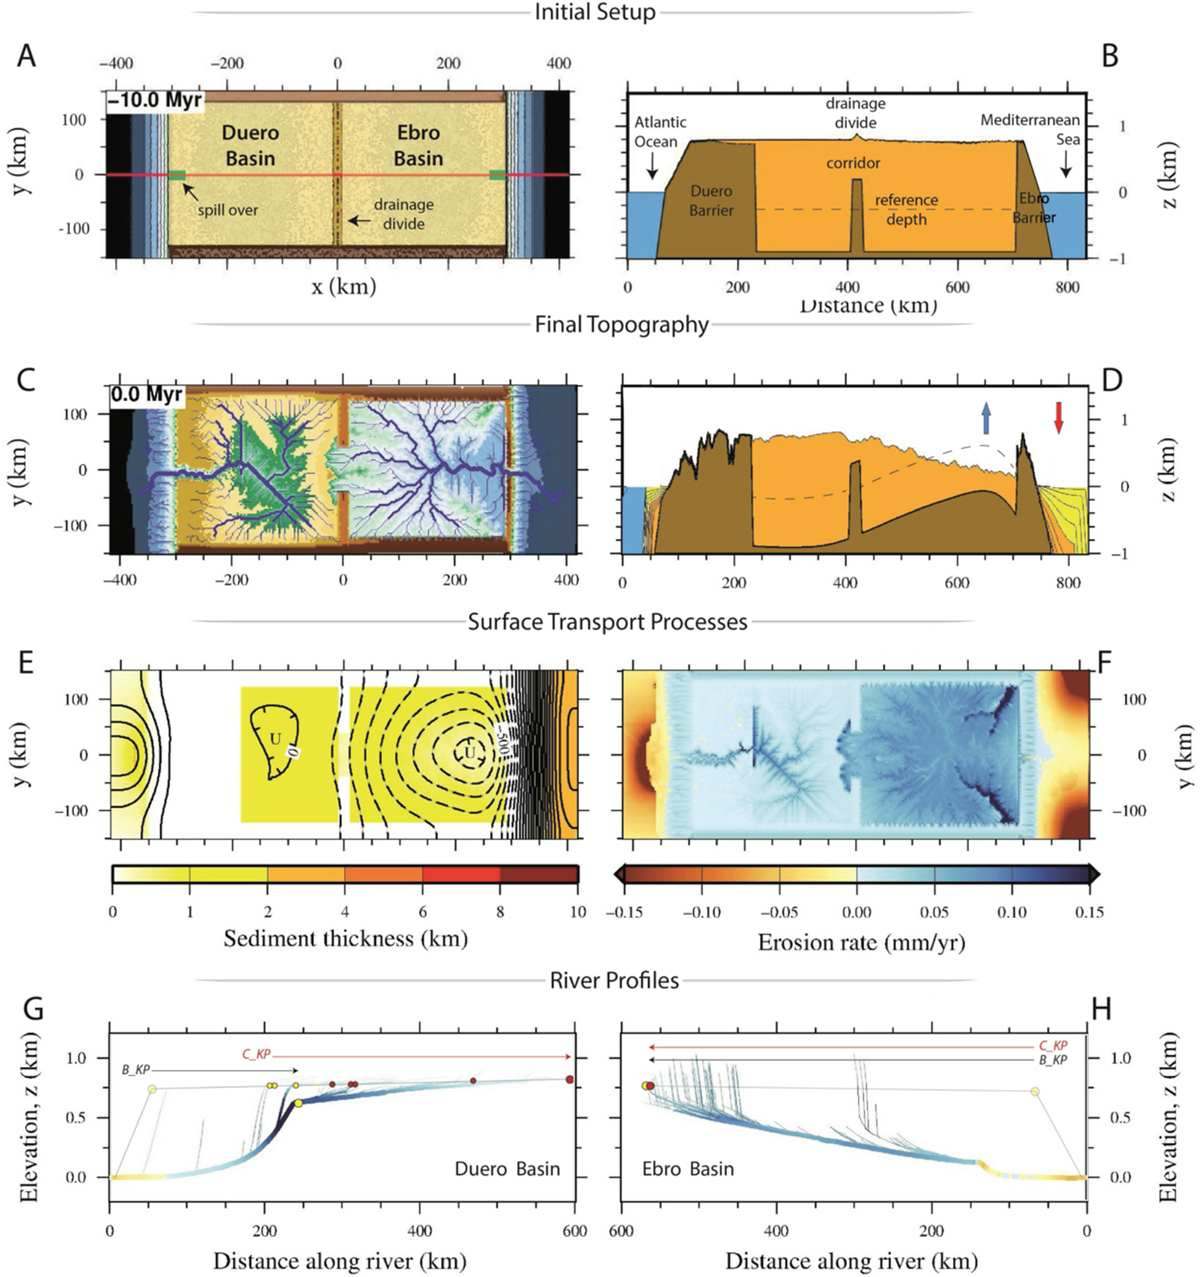
Reference model results. Panels (A) and (B) show the initial setup at t = −10 Myr. (C) Topography obtained at 0 Myr (present). (D) cross-section showing isostatic subsidence and rebound (dashed line and arrows). (E) Cumulative uplift (dashed) and subsidence (bold lines) and sediment thickness. (F) Sedimentation (−)/erosion (+) rates at t = 0. River profiles with knickpoint location for the Duero (G) and Ebro (H) river networks. The points displayed in these boxes indicate the location of bedrock (yellow, B_KP) and cover (red, C_KP) knickpoints (compare with Struth et al., 2019). Arrows indicate the distance traveled by the knickpoints from the initial location (yellow circle at x = 50 km).
Les statistiques affichées correspondent au cumul d'une part des vues des résumés de l'article et d'autre part des vues et téléchargements de l'article plein-texte (PDF, Full-HTML, ePub... selon les formats disponibles) sur la platefome Vision4Press.
Les statistiques sont disponibles avec un délai de 48 à 96 heures et sont mises à jour quotidiennement en semaine.
Le chargement des statistiques peut être long.


