")
")
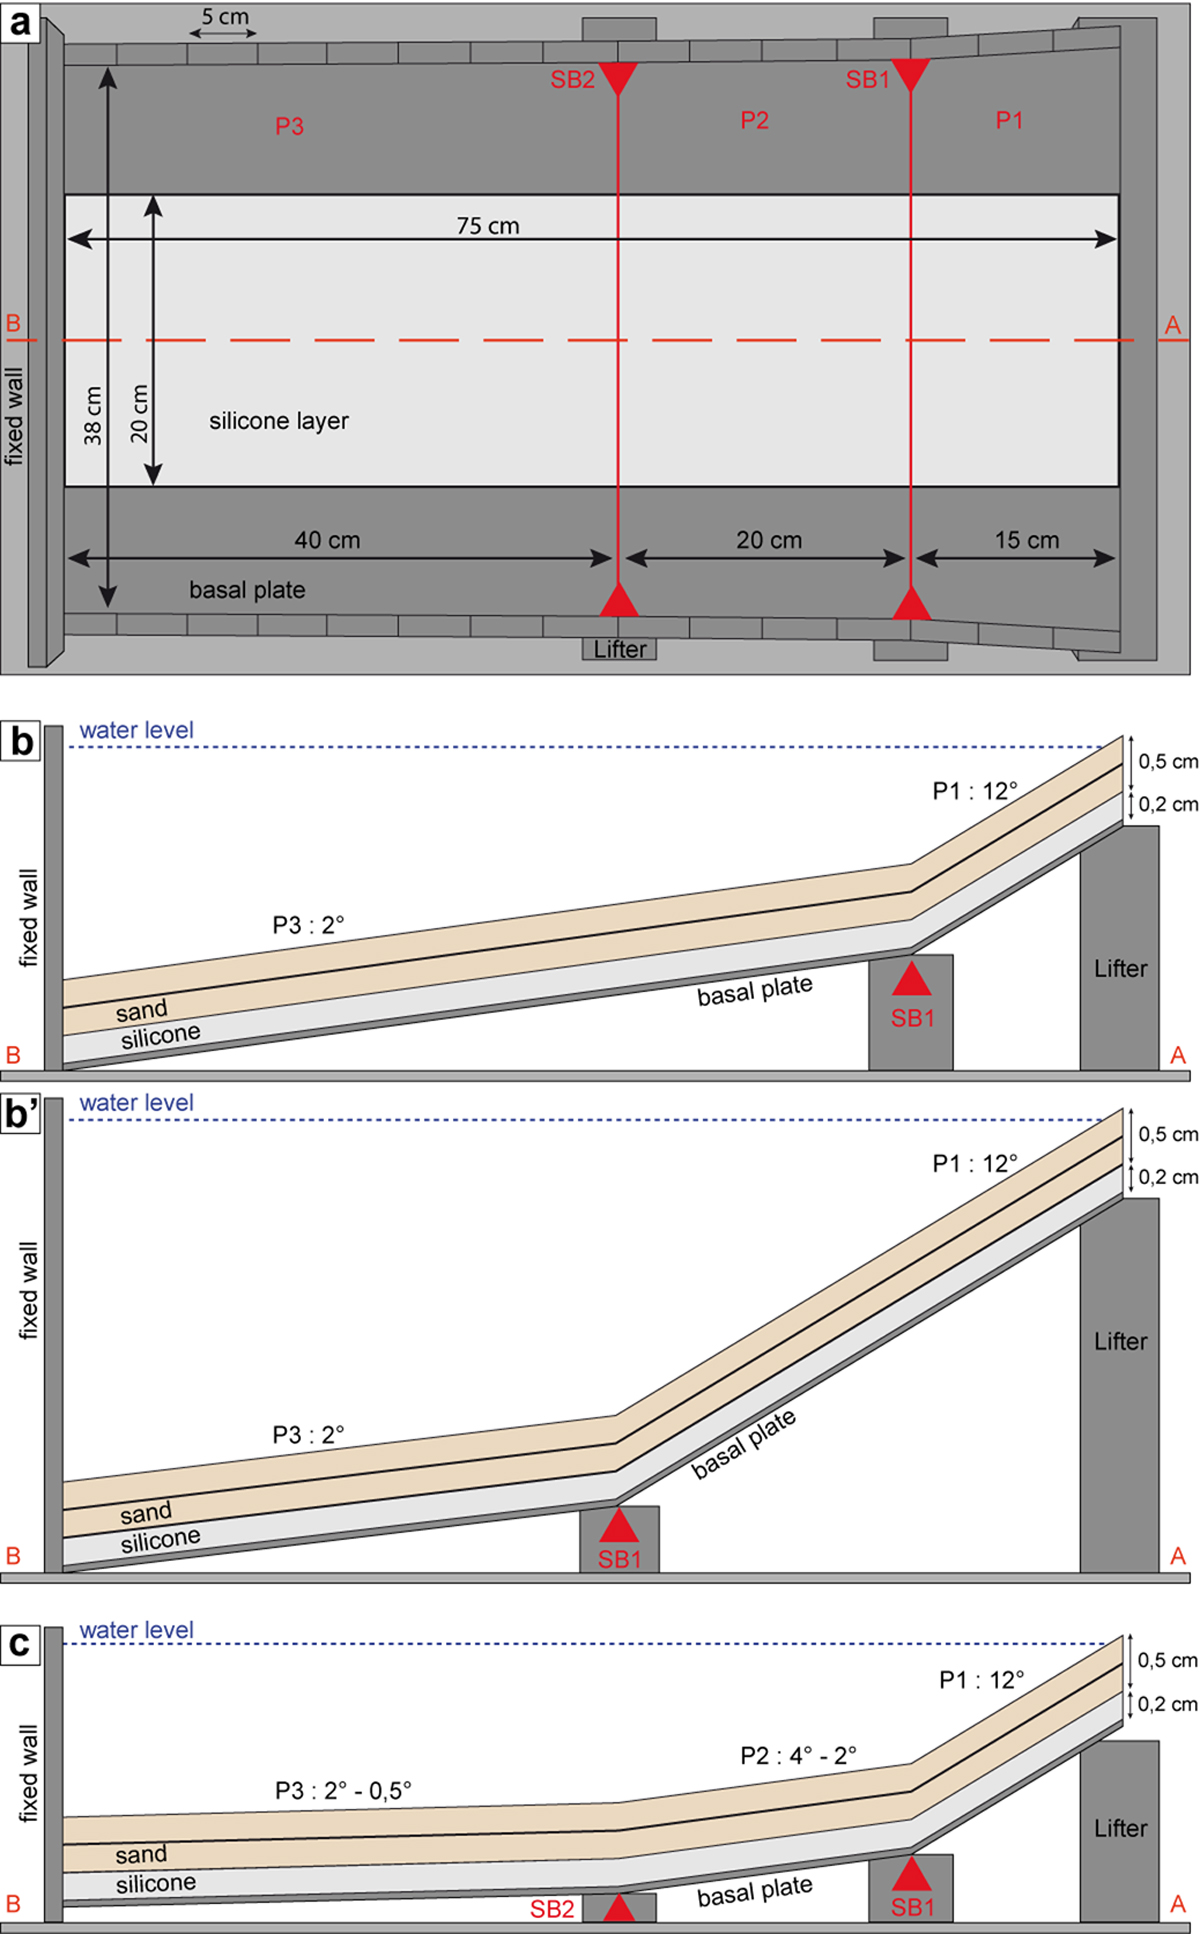
Fig. 2
Download original image
Schematic illustrations of the experimental devices. (a) Surface view for the experiment with two slope breaks (solid red lines) and involving three plates (P1, P2 & P3); the dashed red line shows the location of the axial cross-sections. (b,b’) Cross-section views of the device for the experiments with one slope break (two plates of different lengths, P1 & P3). (c) Cross-section views for the experiments with two slope breaks (see (a)). (b,c) The vertical exaggeration is x8. The red triangles show the location of the slope breaks (SB1 and SB2).
Current usage metrics show cumulative count of Article Views (full-text article views including HTML views, PDF and ePub downloads, according to the available data) and Abstracts Views on Vision4Press platform.
Data correspond to usage on the plateform after 2015. The current usage metrics is available 48-96 hours after online publication and is updated daily on week days.
Initial download of the metrics may take a while.