")
")
Fig. 2
Download original image
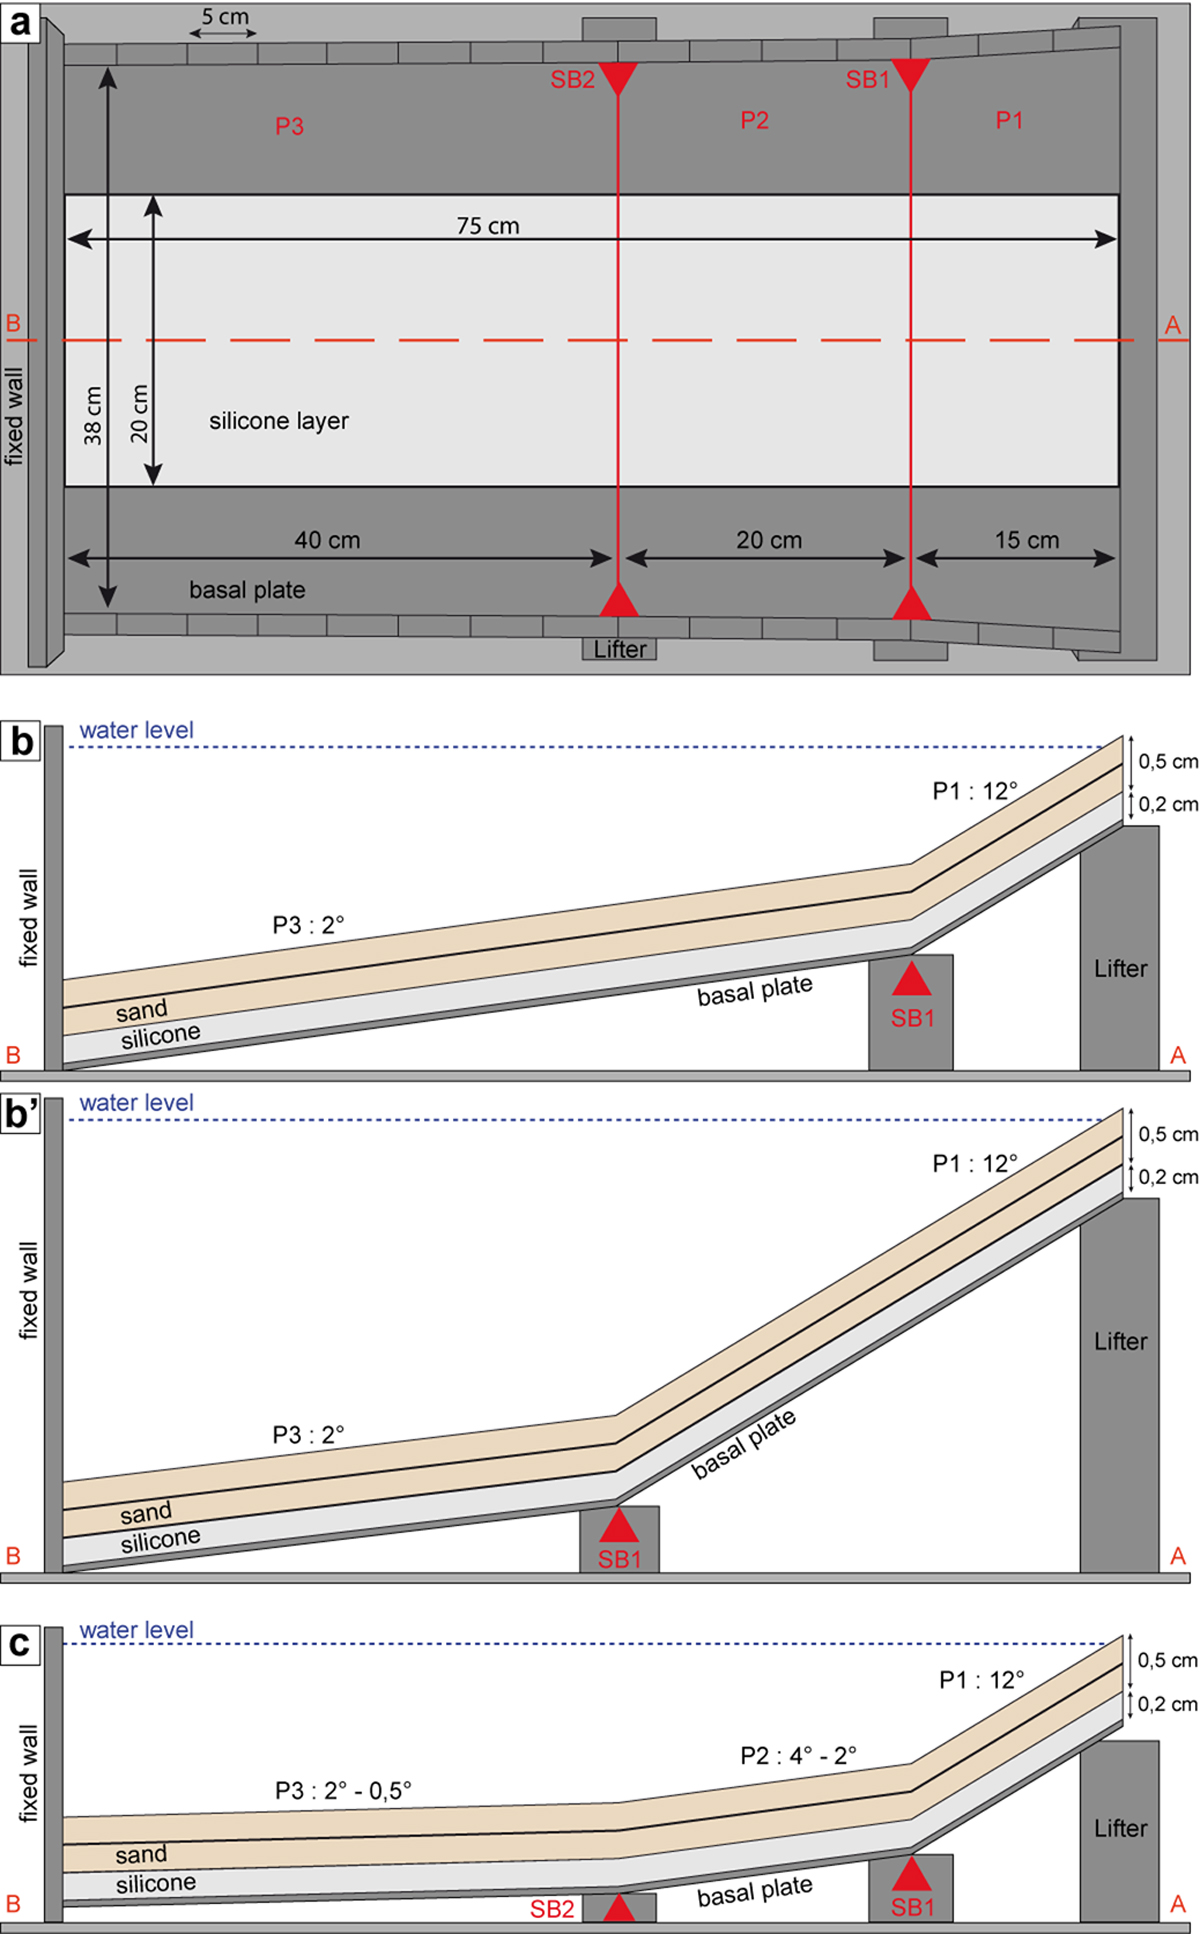
Schematic illustrations of the experimental devices. (a) Surface view for the experiment with two slope breaks (solid red lines) and involving three plates (P1, P2 & P3); the dashed red line shows the location of the axial cross-sections. (b,b’) Cross-section views of the device for the experiments with one slope break (two plates of different lengths, P1 & P3). (c) Cross-section views for the experiments with two slope breaks (see (a)). (b,c) The vertical exaggeration is x8. The red triangles show the location of the slope breaks (SB1 and SB2).
Les statistiques affichées correspondent au cumul d'une part des vues des résumés de l'article et d'autre part des vues et téléchargements de l'article plein-texte (PDF, Full-HTML, ePub... selon les formats disponibles) sur la platefome Vision4Press.
Les statistiques sont disponibles avec un délai de 48 à 96 heures et sont mises à jour quotidiennement en semaine.
Le chargement des statistiques peut être long.