")
")
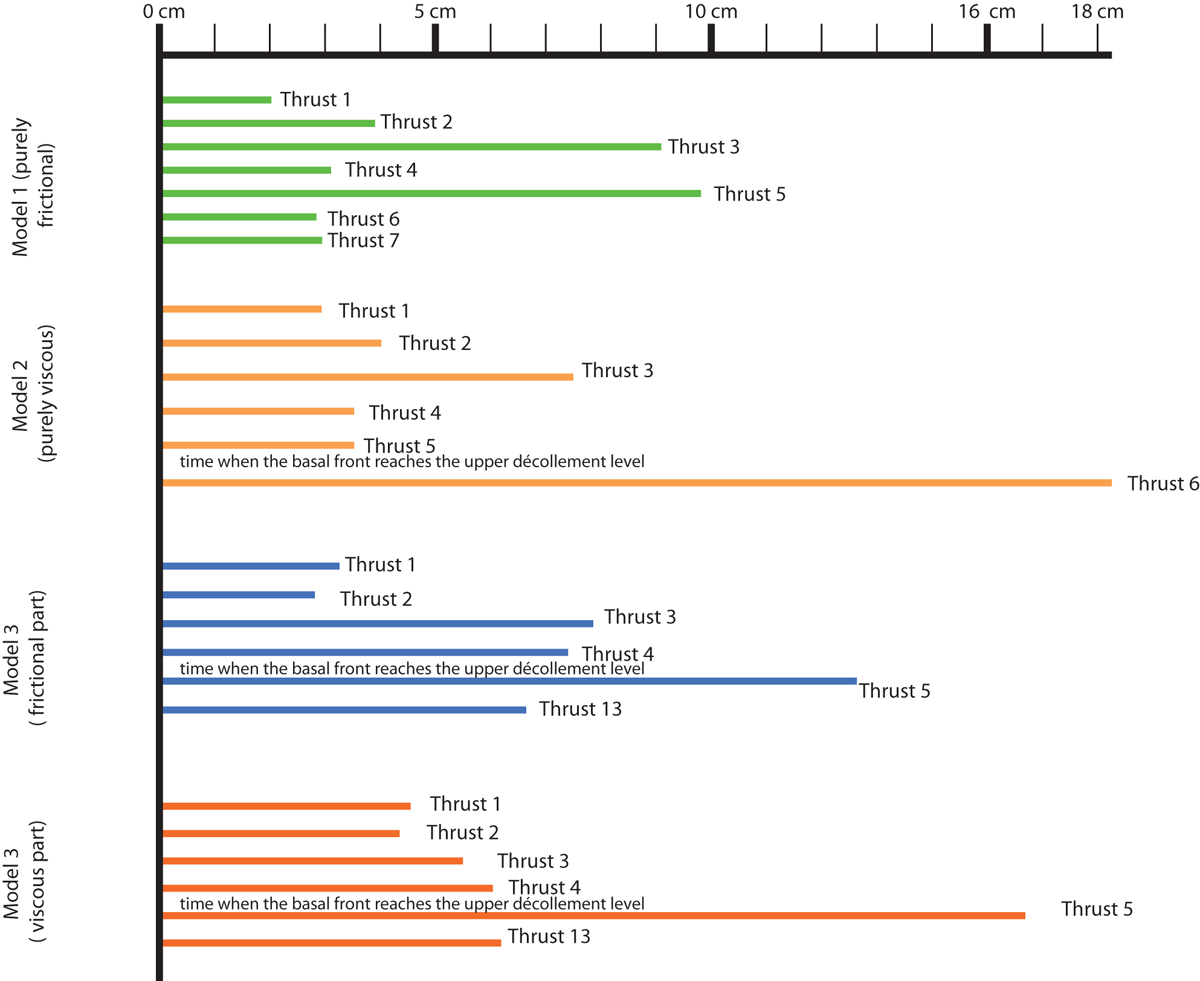
Fig. 6
Download original image
Chart indicating the total displacement along each, basal, sub-salt thrust in each model (and two for Model 3, one in the frictional region, one in the viscous region). The chart illustrates that, at the final stage, fewer new thrusts formed when a viscous layer was interbedded in the cover. It also shows a similar pattern during the first part of the experiment, then a significant increase in total displacement along the frontal thrust once the front reached the area comprising an interbedded viscous layer (Thrust 6 in Model 2, Thrust 5 in Model 3). Note that even in the frictional half of Model 3, Thrust 5 had a significantly larger displacement than in the salt-free model (Model 1), which illustrates the lateral influence on the frictional region of the adjacent salt-bearing region.
Current usage metrics show cumulative count of Article Views (full-text article views including HTML views, PDF and ePub downloads, according to the available data) and Abstracts Views on Vision4Press platform.
Data correspond to usage on the plateform after 2015. The current usage metrics is available 48-96 hours after online publication and is updated daily on week days.
Initial download of the metrics may take a while.