")
")
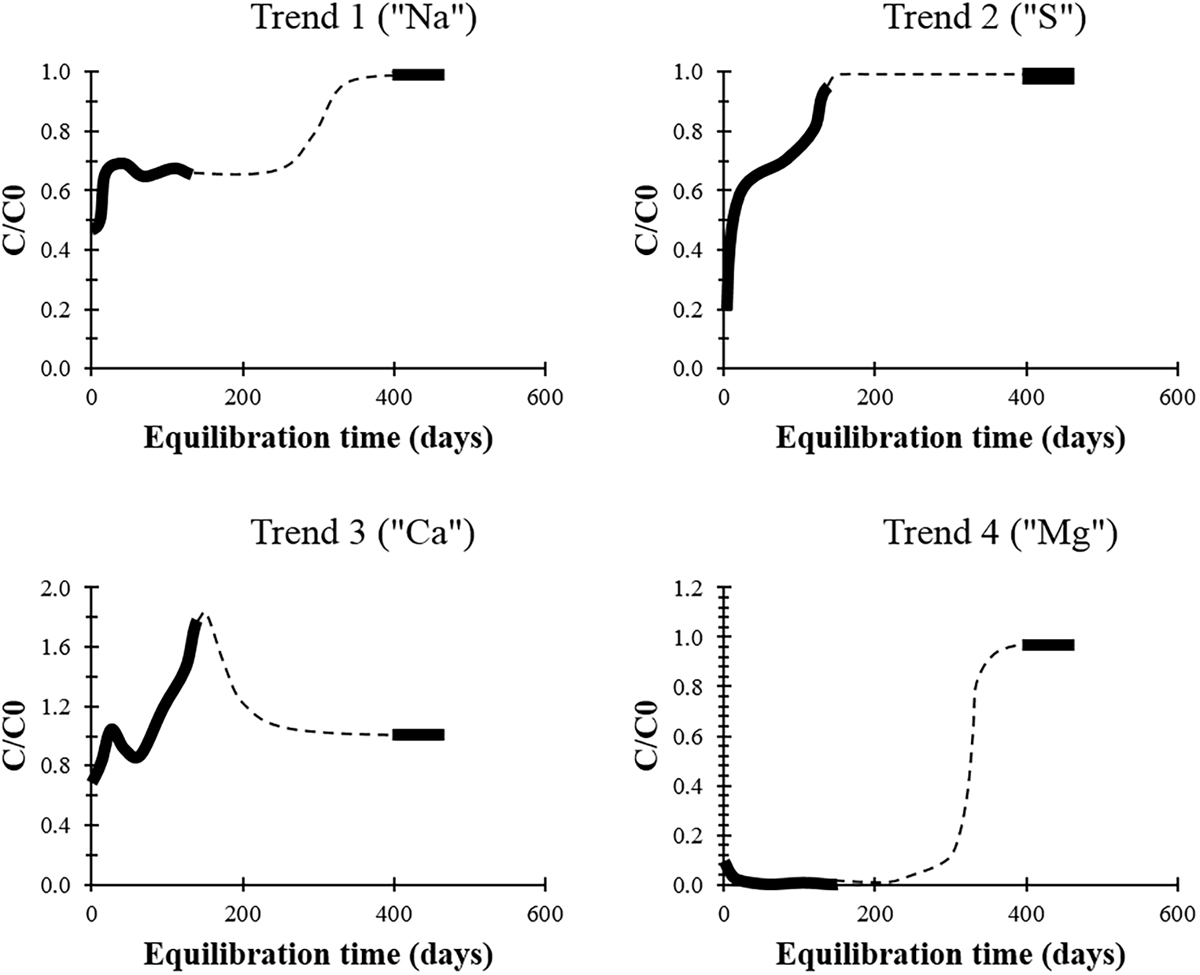
Fig. 8
Download original image
Trends in major elements and Cr(VI) concentrations in leachate during the pore solution equilibration experiment. Absolute concentrations C are compared to reference concentration C0 found by initially leaching a fresh sample of COPR using the fast percolation method (see methods and materials). No measurements were made between 140 and 400 days. The lack of data between 140 and 400 days is related to our initially wrong appreciation of kinetic reactions. Indeed, we initially thought that steady state between solid and pore water had been reached after 140 days, because of the observed relative stability of major elemental concentrations (except for calcium and sulfur). Thus after 140 days, we stopped doing measurements. Just out of curiosity, a new measurement was done after 400 days, which revealed that all concentrations had evolved, i.e., that they had levelled off close to their initial values. It can be concluded that 400 days is about the time needed to reach true steady state conditions in the material. The dashed line is drawn by hand and represents a probable course of the curve. Trend 1 is representative of elements Na, K and Cr(VI). Trend 2 is representative of element S, trend 3 of Ca and trend 4 of Mg. The schematic representations are based on chemical data in Figure S7 (Supplementary Material S7).
Évolution temporelle des concentrations de quelques éléments majeurs et du Cr(VI) dans les lessivats de l’expérience de ré-équilibration du matériau.
Les statistiques affichées correspondent au cumul d'une part des vues des résumés de l'article et d'autre part des vues et téléchargements de l'article plein-texte (PDF, Full-HTML, ePub... selon les formats disponibles) sur la platefome Vision4Press.
Les statistiques sont disponibles avec un délai de 48 à 96 heures et sont mises à jour quotidiennement en semaine.
Le chargement des statistiques peut être long.