")
")
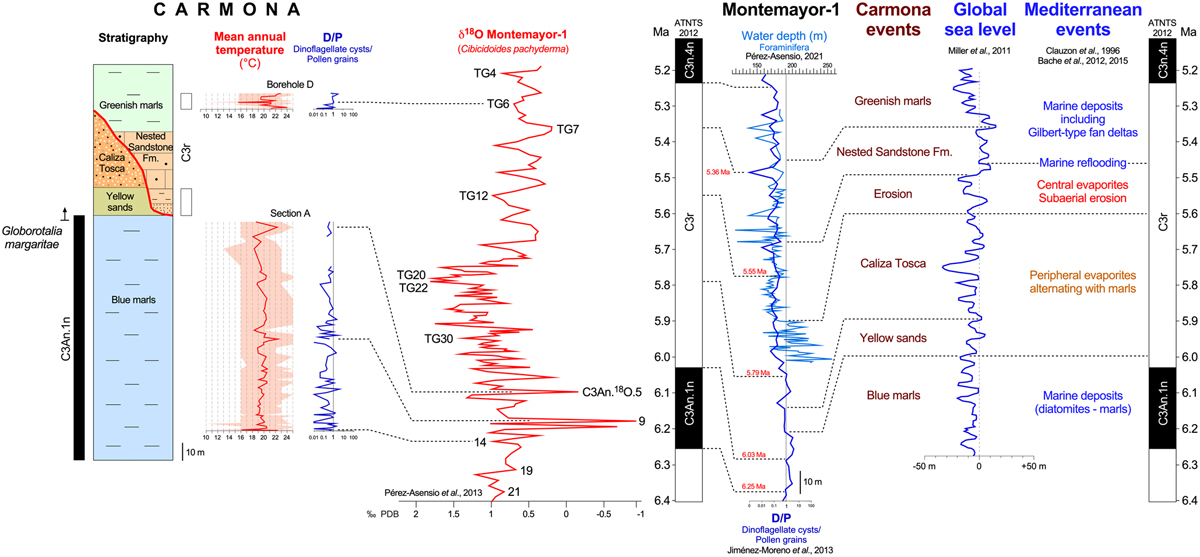
Fig. 7
Download original image
Curve of the D/P ratio of the Carmona series with respect to its chronostratigraphy correlated with the Montemayor-1 oxygen isotope curve. Comparison with the D/P curve and the foraminifer-based paleobathymetric curve (Pérez-Asensio, 2021) from the Montemayor-1 hole and proposed relationships with the global sea level and Mediterranean events, all calibrated with ATNTS2012 as the oxygen isotope curve. D/P curves are drawn according to a semi-logarithmic scale.
Current usage metrics show cumulative count of Article Views (full-text article views including HTML views, PDF and ePub downloads, according to the available data) and Abstracts Views on Vision4Press platform.
Data correspond to usage on the plateform after 2015. The current usage metrics is available 48-96 hours after online publication and is updated daily on week days.
Initial download of the metrics may take a while.