")
")
Fig. 8
Download original image
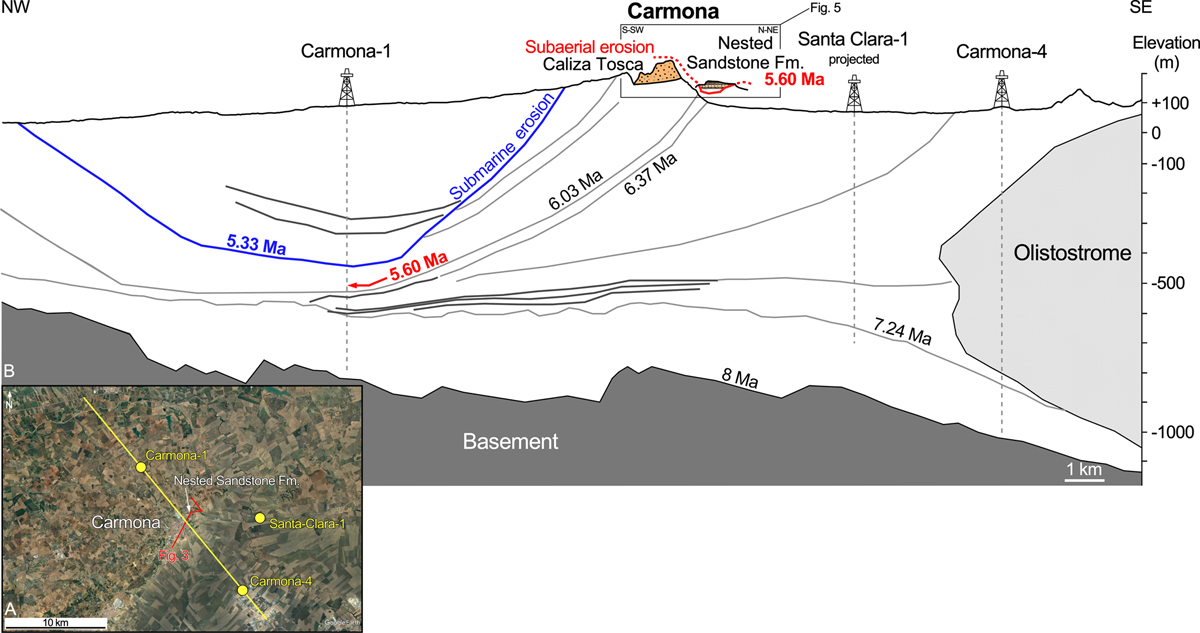
Chronostratigraphy of the area of Carmona based along an industrial seismic profile including three deep industrial boreholes and this work. A, The Carmona area from Google Earth image with plotted seismic profile and industrial boreholes and location of the studied cross profile (Fig. 3). B, Interpreted seismic profile and industrial drilled sections showing the different lithostratigraphic and biostratigraphic units and their boundary age according to Ledesma (2000) − some ages are updated with respect to Hilgen et al. (2012) − contrasting with the studied cross profile (Fig. 5). The figure emphasizes the diverse types of erosion and their age that affected the area of Carmona in the late Messinian. The red arrow pinpoints the level of deposition in the marine basin of the eroded material from the Caliza Tosca. The light grey lines indicate sedimentary more marked reflectors. The dark grey lines indicates the thick turbiditic reflectors.
Current usage metrics show cumulative count of Article Views (full-text article views including HTML views, PDF and ePub downloads, according to the available data) and Abstracts Views on Vision4Press platform.
Data correspond to usage on the plateform after 2015. The current usage metrics is available 48-96 hours after online publication and is updated daily on week days.
Initial download of the metrics may take a while.