")
")
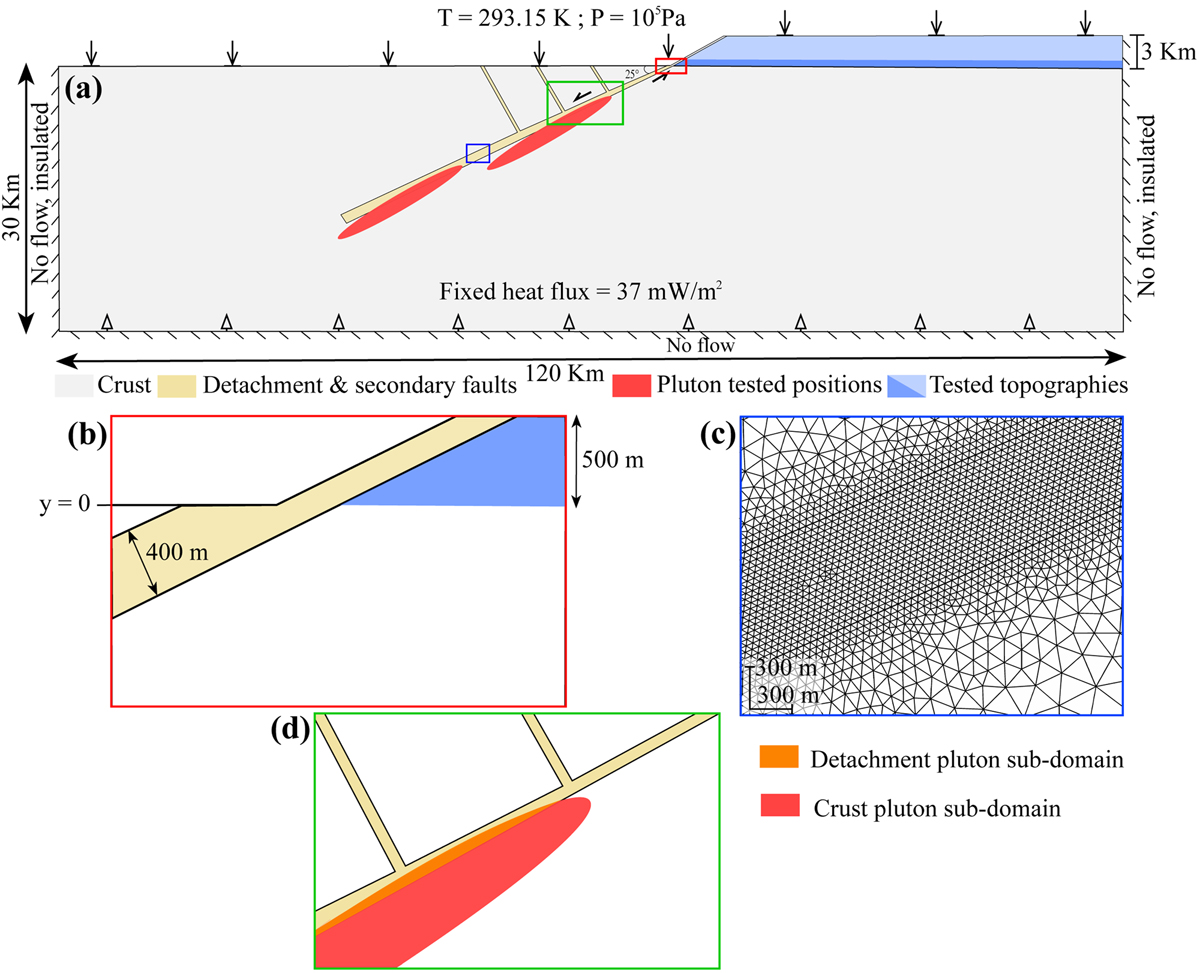
Fig. 4
Download original image
2D model geometries, boundary and initial conditions with three distinct views: (a) overview of the system showing the three tested topographies and the two pluton positions. At the top, the arrows account for the surface pressure (105 Pa) and temperature (20 °C). The arrows at the bottom correspond to the mean heat flux for the continental crust at the end of the Carboniferous (Jaupart et al., 2015): that period has been selected in order to fit with our application on uranium mineralized detachment systems which formed around 300 Myr in the South Armorican domain (Ballouard et al., 2017). The model size allows assuming no lateral flow with thermal insulation on both the left and right sides. Colored enlargements highlight (b) the topography and detachment thickness near the surface; (c) the mesh resolution in the detachment domain; (d) the two pluton sub-domains.
Current usage metrics show cumulative count of Article Views (full-text article views including HTML views, PDF and ePub downloads, according to the available data) and Abstracts Views on Vision4Press platform.
Data correspond to usage on the plateform after 2015. The current usage metrics is available 48-96 hours after online publication and is updated daily on week days.
Initial download of the metrics may take a while.