")
")
| Issue |
BSGF - Earth Sci. Bull.
Volume 196, 2025
|
|
|---|---|---|
| Article Number | 7 | |
| Number of page(s) | 11 | |
| DOI | https://doi.org/10.1051/bsgf/2025006 | |
| Published online | 12 mai 2025 | |
Surface displacements induced by underground activities from 2014 to 2019 in the former Lorraine coalfield, northeastern France
Déplacements de surface induits de 2014 à 2019 par les activités souterraines dans l’ancien bassin houiller lorrain
1
GeoRessources, Université de Lorraine − CNRS, Campus Artem, BP14234, 54042 Nancy Cedex, France
2
GEODERIS, 1 rue Claude Chappe, 57075 Metz Cedex 3, France
* Correspondence: Cette adresse e-mail est protégée contre les robots spammeurs. Vous devez activer le JavaScript pour la visualiser.
Received:
16
August
2024
Accepted:
15
March
2025
Abstract
In the former Lorraine coalfield, northeastern France, mining subsidence has occurred over decades. After the end of coal mining in 2004, uplift started to be detected throughout the basin. In recent years, a coalbed methane (CBM) extraction project has been considered in the same region. This extraction project targets virgin coal layers at about 1 km depth, with production tests carried out between February 2017 and December 2019. Given this particular context, combination of historical and recent subsurface activities, it is useful to characterise the current induced surface displacements in the area. For this reason, PS-InSAR (Hooper A, Bekaert D, Spaans K, Arıkan M. 2012. Recent advances in SAR interferometry time series analysis for measuring crustal deformation. Tectonophysics 514-517: 1–13.) has been applied to Sentinel-1 SAR images over the period 2014-2019, covering the entire former coalfield. Our results confirm the occurrence of uplift movements above the abandoned mine panels, with a maximum mean velocity of +9 mm/yr in the LoS (Line of Sight) direction, over the whole period. This uplift decreases through time; its rate is more important over the first half of the study period. When comparisons are available, our results correlate well to on-ground levelling measurements. This phenomenon is related to the ongoing flooding of the mined-out panels in the coal basin. Due to the poor spatial coverage of the data above the CBM production test zone, no conclusion could be drawn regarding potential surface displacements associated with this activity, but this result may be viewed in light of the rare observations available in active CBM production in other regions around the world. We also found out that, since mid-2018, subsidence has been detected above an active anhydrite underground mine, with an absolute mean velocity approximately 4 mm/yr in the Line-of-Sight (LoS) velocity over the period January 2017 to December 2019. Further investigations are required to determine the origin of these displacements. In conclusion, the map of the current displacements in the study area reflects both past (mining) and present (quarrying) underground operations, and may also serve to inform discussions on possible future ones (CBM extraction).
Résumé
Dans l’ancien bassin houiller lorrain, situé au nord-est de la France, des affaissements miniers se sont produits pendant des décennies. Depuis la fin de l’exploitation minière en 2004, des soulèvements ont été détectés dans tout le bassin. Par ailleurs, une exploitation de gaz de couche de charbon (CBM) a été envisagée dans la région. Ce projet d’exploitation s’intéresse à des couches de charbon vierges, situées à environ 1 km de profondeur, dans lesquelles des essais de production ont été conduits de février 2017 à décembre 2019. Compte tenu de ce contexte, se pose la question de l’état actuel des déplacements de surface dans la zone. La méthode PS-InSAR (Hooper et al., 2012) a donc été appliquée aux images radar Sentinel-1 sur la période 2014-2019. En premier lieu, nos résultats confirment l’existence d’un mouvement de soulèvement au-dessus des anciennes mines, avec une vitesse maximale de l’ordre de +9 mm/an selon la ligne de visée du satellite, sur l’ensemble de la période. Ce soulèvement diminue au cours du temps ; il est plus important au cours de la première moitié de la période. Lorsque les comparaisons sont possibles, nos résultats sont bien corrélés aux mesures de nivellement réalisées au sol. Ce phénomène est attribué à l’ennoyage toujours en cours des travaux miniers. En second lieu, à cause de la faible couverture spatiale des données InSAR à la verticale de la zone de test de production de CBM, aucune relation n’a pu être établie entre cette activité et d’éventuels déplacements de surface. Nos résultats peuvent néanmoins être comparés avec les rares observations disponibles dans d’autres bassins de production de CBM à travers le monde. Incidemment, nous montrons que depuis mi-2018, un affaissement est détecté au-dessus d’une carrière d’anhydrite souterraine, avec une vitesse moyenne de l’ordre de −4 mm/an selon la ligne de visée du satellite, sur la période janvier 2017 à décembre 2019. Des investigations complémentaires seraient nécessaires pour déterminer l’origine exacte de ces déplacements. En conclusion, la carte des déplacements de surface actuels établie dans cette étude reflète tout à la fois les exploitations passées (minières) et actives (carrières) dans le bassin houiller lorrain, et permet de discuter les impacts d’éventuelles exploitations futures (extraction de CBM).
Key words: PS-InSAR / Lorraine coalfield / mine flooding / coalbed methane / uplif
Mots clés : PS-InSAR / bassin houiller lorrain / ennoyage minier / gaz de couche de charbon / soulèvement
© G. Modeste et al., Published by EDP Sciences 2025
 This is an Open Access article distributed under the terms of the Creative Commons Attribution License (https://creativecommons.org/licenses/by/4.0), which permits unrestricted use, distribution, and reproduction in any medium, provided the original work is properly cited.
1 Introduction
Subsidence is one of the main disturbances caused by underground activities. It may occur both during the exploitation phase and over a few decades after the end of this activity. Its regular and accurate monitoring has become a crucial issue for both the local population and the operators. In the early 1990s, a new method emerged that revolutionized surface displacement monitoring: radar interferometry, or InSAR, offers the possibility of tracking surface displacements over large areas on a regular basis with accuracy of an approximately 1 mm (Ketelaar 2009). This method consists of processing satellite radar images continuously acquired by satellites. This method has been widely used on numerous occasions to study and monitor phenomena of natural or anthropic origin (Massonnet and Feigl 1998; Amelung et al., 1999; Bürgmann et al., 2000; Bawden et al., 2001). In addition, the combination of data from several satellites makes it possible to monitor surface displacements over several decades (Declercq et al., 2017).
In the former Lorraine coalfield, northeastern France, along the border with Germany (Fig. 2), coal was mined from the mid-19th century to 2004. Water had to be pumped out during exploitation because mining operations induced the fracturing of the overburden and superficial water inflow into the mines. Since 2006, pumping has stopped, causing the progressive flooding of the mined-out panels (Hamm and Bazargan Sabet 2010). This flooding is regularly monitored by pressure sensors installed in mine shafts. Both the mining activity and the ongoing flooding have led to surface displacements. Detected surface displacements were mainly related to these anthropic sources rather than to tectonics, which is very slow in the area (Doubre et al., 2021). Mining extraction induced subsidence, reaching 15 m of cumulative displacement, while the flooding is inducing uplift, reaching the maximum rate of uplift of 5 cm/yr. In fact, during the mining period, the overburden above the extracted panels is fractured, causing its collapse. Deformation propagated through the overburden, causing a surface subsidence whose magnitude depends on the seam thickness, its depth and the size of the mined panels (Fig. 1) (Kratzsch 1983; Whittaker and Reddish 1989; Alheib et al., 2005). During progressive flooding, the uplift may be induced by an increase of pore pressure in the mined-out panels and in the disturbed layers above (Bekendam and Pöttgens 1995).
In the Lorraine coalfield, mining subsidence was monitored by repeated levelling campaigns throughout the coal exploitation period. A study of surface displacements was carried out by radar interferometry over the period 1992-2009, and results were compared to levelling measurements (Samsonov et al., 2013). This study highlights the transition from mining-induced subsidence to post-mining uplift. In addition, surface displacements induced by mine flooding are currently monitored by levelling since 2006. Available data suggest that uplift is still ongoing, a decade after the end of mine dewatering. The current flooding monitoring also reveals that the water level is still rising.
Concomitantly, starting in the mid-2000s, a coalbed methane (CBM) extraction project was under consideration in the former Lorraine coalfield, under the impulse of the company “La Française de l’ Énergie” (FDE). In fact, methane is naturally present in coal seams, adsorbed on pore surfaces. The project involved the primary recovery of methane from virgin coal seams, which consists in the continuous pumping of the pore water to reduce pore pressure in the seam. The pore pressure reduction leads to the desorption of the available methane to be extracted. As part of the project, a drilling and production test was conducted from February 2017 to December 2019 on a site located at about 2 km from the closest mined-out panel. In a traditional reservoir, a pore pressure drop induces stress variation, which causes it to deform. The deformation is usually compaction, thus vertical and uniaxial, reaching approximately 1 % (Pijnenburg et al., 2019). In some cases, the reservoir compaction induces surface displacement (Smith et al., 2019). In CBM extraction, in addition to this depletion effect, volumetric strain is also induced by the methane desorption, which causes the shrinkage of the coal matrix (Liu and Harpalani 2013). This desorption effect is attributed to a change in free surface energy in coal pores (White et al., 2005). However, the occurrence of surface displacement related to CBM exploitation is poorly documented in the literature.
Given this context, it is important to better characterise the current surface displacements in the former Lorraine coalfield. In this study, we present a map of surface velocities in this area from November 2014 to December 2019, based on PS-InSAR (Hooper et al., 2012). Close to the mined-out panels, the monitored displacements can be compared to displacements measured with on-ground levelling since 2006. Close to the test site for CBM extraction, the potential correlation between surface displacement and the CBM extraction remains unclear, due to the limited spatial coverage of the results. Nevertheless, surface displacements were detected above an active anhydrite underground quarry. There, subsidence began shortly after the expansion of the extraction zone.
For this reason, our map of the current displacement is shown to reflect past (mining) and present (quarrying) underground operations in the Lorraine coalfield, and can be used to discuss the possible impacts of eventual future ones (CBM extraction).
 |
Fig. 1 Schematic cross-section of a mining subsidence with Am the maximum central subsidence and γ the angle of influence, which is required to define the impacted surface area. Coupe schématique d’un affaissement minier avec Am l’affaissement maximal et γ l’angle d’influence, nécessaire pour définir l’aire en surface impactée par l’affaissement. |
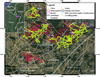 |
Fig. 2 Location map of the Lorraine coalfield. with Google Satellite imagery as the basemap. Bam.: Bambiderstroff; Ber.: Berwiller-en-Moselle; Car.: Carling; Cre.: Creutzwald; Fal.: Falck; Fol.: Folschviller; For.: Forbach; Fre.: Freyming-Merlebach; Gue.: Guerting; Ros.: Petite-Roselle; Sti.: Stiring-Wendel. Localisation et carte du bassin houiller lorrain avec en fond de carte, les vues aériennes de Google (Google Satellite). Bam.: Bambiderstroff; Ber.: Berwiller-en-Moselle; Car.: Carling; Cre.: Creutzwald; Fal.: Falck; Fol.: Folschviller; For.: Forbach; Fre.: Freyming-Merlebach; Gue.: Guerting; Ros.: Petite-Roselle; Sti.: Stiring-Wendel. |
2 The former Lorraine coalfield
The Lorraine coal basin formed during the Carboniferous period Table 1 and extends from the German Saar region to the Meuse River, covering an area of approximately 140 km by 70–80 km. Coal deposits are Westphalian to Stephanian in age (Fleck et al., 2001; Izart et al., 2005). It is composed of coal seams several metres thick. These veins outcrop at the eastern boundary of the basin, on the German side of the border, and they gently plunge to a depth of several thousand metres towards the western boundary. The deposits are strongly folded and faulted, forming anticlines and synclines (Fig. 2). These deformations are due to the Hercynian orogeny, in a strike-slip regime (Korsch and Schäfer 1995). Due to this structure, the seams have variable dip angles throughout the basin, ranging from dip angles from flat (0–30°) to sub-vertical (60–90°). The Carboniferous terrains are overlain by Permian and Mesozoic formations Table 1. These Mesozoic formations are mainly composed of the “Grès vosgiens” sandstone dating from the Bundsandstein, overlain by an alternance of marl, limestone, anhydrite, and clay layers dating from the Muschelkalk (Donsimoni 1981).
Coal mining in the Lorraine coalfield was widespread and heterogeneous. Various mining methods were used, depending on the geometry of the seams and the period of exploitation. The mining methods also evolved with time, in response to technological developments (Doumergue 1962). Mining concessions have covered almost 500 km2, separated in four sectors: East (Forbach), West (Creutzwald, Berwiller-en-Moselle), Centre (Freyming-Merlebach) and South (Folschwiller) (Fig. 2). Approximately 800 million tonnes of coal were extracted over the entire period of activity. The exploitation reached a depth of 960, 1250, 1050, and 850 m in the South, Centre, East and West sectors, respectively. The lack of profitability of the exploitation led to the cessation of mining activity in 2004.
The FDE company started its prospective work in the mid-2000s. A test production phase was conducted from February 2017 to December 2019 at the Lachambre well (Fig. 2). The tested coal seam is located at a depth of 1 km, approximately 2 km away from the closest abandoned mine panel.
Synthetic geological log of the Lorraine coalfield.
Log synthétique du bassin houiller lorrain.
3 Method and Data
3.1 Persistent Scatterer Interferometry: PS-InSAR
Considering that the area under study is mainly covered by agricultural fields and forests, which are unsuitable for traditional InSAR processing, we used the Persistent Scatterer method implemented in the Stanford Method for Persistent Scatterer software (StaMPS) (Hooper et al., 2012). To reduce the volumetric and temporal decorrelations related to fields and forests, the method relies on the presence of dominant scatterers, which mainly corresponds to infrastructures (roofs, walls, railways…). PS-InSAR method has been proven efficient to detect surface displacements in regions of low coherence, especially in the case of anthropogenic sources (Guéguen et al., 2009; Heimlich et al., 2015; Modeste et al., 2021). To compute and prepare interferograms from Sentinel-1 SAR images, we used a processing chain developed on the Sentinel Application Platform (SNAP) software (Foumelis et al., 2018). Each interferogram is generated using a common reference image. In StaMPS, pixels are selected according to two criteria, their amplitude dispersion and the noise level in their phase (Hooper et al., 2007). The unwrapping step, using a spatio-temporal algorithm (Hooper and Zebker 2007), is then used with the selected pixels to estimate the time evolution of the displacement. The mean LoS (Line of Sight) velocity of each pixel is calculated from the time evolution of the displacement by a linear regression with a least-squares method.
3.2 Data
We process the ascending track 88 from the Sentinel-1 archive, a C-band satellite. We have downloaded 217 images, which cover the period from 2014/11/04 to 2020/01/01. The SAR image acquired on 3 July 2017 serves as the reference image, which is approximately in the middle of the archive. The mean look and incidence angles are approximately 36.1° and 38.9°. The repetition time of acquisition is 12 days from November 2014 to September 2016, and then 6 days from October 2016 to January 2020. Following Sentinel-1 image processing, the results have a resolution of approximately 20 × 20 m.
To estimate the topographic contribution, the Shuttle Radar Topography Mission SRTM (Farr and Kobrick 2000), with a resolution of 30 m, was used.
Unlike SAR images, which are in open access, levelling measurements have been provided by the “Departement de Prévention et de Sécurité Minière Est” (DPSM Est). Levelling campaigns are conducted once a year over three sectors: East, Centre and West (Fig. 2). Hereafter, the results from a single levelling point per sector are presented and compared to our InSAR results.
4 Results
4.1 Surface LoS velocity field
As expected, the spatial coverage of our InSAR results is heterogeneous and located above cities and infrastructures. Despite the large surfaces of agricultural fields and forests, surface displacements are detected throughout the former coal basin (Fig. 3). Most of the calculated velocities range from −1 to +1 mm/yr. The areas associated with these velocities can be considered as stable, without significant displacement. By superposing our InSAR results on the contour of mined panels, we observe that uplifting areas are above and near mined panels, in the East, Centre and West sectors (Fig. 3). The South sector is stable over the whole period. In the East and Centre sectors, velocities are positive and significant, reaching about +9 mm/yr. In the West sector, velocities are also positive but lower, reaching +3 to +4 mm/yr. Positive velocities indciate movements toward the satellite (LoS) that could correspond at least partially to vertical uplift. Impacted areas are large, with lengths of about 10 km in the SW-NE direction and 5 km in NW-SE direction for the East and Centre sectors (Fig. 3). In contrast, negative velocities, reaching −6 mm/yr, are detected over a small area, approximately 1 km2, in the city of Saarbrücken, in Germany. In this case, the associated movement could be a downward vertical displacement.
From our InSAR results, we produce two additional mean LoS velocity maps over two different periods, from November 2014 to December 2017 (Fig. 4. a) and from January 2017 to December 2019 (Fig. 4. b). Each period is approximately 3-years long. In addition, the second period covers a little more than the whole CBM extraction test period, from February 2017 to December 2019. With these maps, the mean LoS velocity can be compared from one period to the other, and changes can be detected between those two periods.
During both periods, an uplift is occurring in all the three, East, Centre and West sectors (Fig. 4). However, the amplitude of the velocity is decreasing from +12 mm/yr over the first period to +10 mm/yr over the second period. Since mean LoS velocities are computed by applying a linear regression to the time evolution of the displacement, this may explain why the amplitude is higher for each partial period than for the whole one. However, these results are not precise enough to predict the end of the uplift. In addition, to the East of Faulquemont city, surface displacements are detected over the second period, with a mean LoS velocity about −4 mm/yr, while the area was stable over the first period. Finally, the area of Lachambre is stable over both periods while the test production phase was conducted over the whole second period.
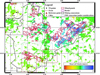 |
Fig. 3 Mean LoS velocity map for the period from November 2014 to December 2019. The red triangle and black points indicate location of the reference point used for the PS-InSAR processing and where LoS displacement time series have been realized, respectively. The brown polygons represent the zoomed-in areas in the inserts on the left. Carte de vitesses moyennes selon la ligne de visée du satellite sur la période de novembre 2014 à décembre 2019. Le triangle rouge et les points noirs indiquent la position du point de référence pour le traitement PS-InSAR et de déplacement, respectivement. Les polygones marron correspondent aux zones agrandies dans les encarts à gauche. |
 |
Fig. 4 (a) Mean LoS velocity map over the period November 2014–December 2017. (b) Mean LoS velocity map over the period January 2017–December 2019. The same colour bar was used to produce those two maps. (a) Carte de vitesses moyennes selon la ligne de visée du satellite sur la période novembre 2014–décembre 2017. (b) Carte de vitesses moyennes selon la ligne de visée du satellite sur la période janvier 2017–décembre 2019. La même barre de couleurs a été utilisée pour générer les deux cartes. |
4.2 Time evolution of displacement
To assess the quality of our observations, our InSAR results were compared to ground-based levelling measurements (Fig. 5. a-d). First, mean LoS velocities from our InSAR results are compared to mean LoS velocities from levelling (Fig. 5. a). For both datasets, the mean LoS velocity is computed by a linear regression of the displacement using a least-square method. Regarding the levelling data, the mean vertical velocities are projected along the LoS direction by assuming an incidence angle of 38.9°. The comparison is performed between the levelling point and the closest pixel, within a 100 m. The mean LoS velocities from both datasets are similar (Fig. 5. a): 45.5 % of the values are within ±1 mm/yr, 80.8 % within ±2 mm/yr and 95.0 % within ±3 mm/yr. Among the 892 studied points, the absolute difference in mean LoS velocity is greater than 3 mm/yr for only 45 points (5 %). The differences can be explained by acquisition errors, either punctual or systematic (unstable reference point), during levelling campaigns rather than by the occurrence of real horizontal displacements. The last hypothesis is not consistent with the spatial layout of the 45 points, which are either isolated or very localized. For example, among the 55 levelling points across the city of Creutzwald, the mean LoS velocity is different for 15 of them.
Then, we compared LoS displacement time series from both dataset at three locations: Rosbruck, Freyming-Merlebach and Creutzwald (points 1, 2 and 3 respectively, in Fig. 3). At Rosbruck and Freyming-Merlebach, the amplitude and the time evolution of the LoS displacement obtained from both methods are consistent (Fig. 5. b and c). Regarding Creutzwald, small discrepancies are present between the two time series. However, as mentioned previously, the levelling point at Creutzwald is one of the points which might be impacted by an acquisition bias. Thus, from the comparison between levelling and InSAR time series, we confirm that the detected displacements above abandoned mined-out panels are essentially vertical.
Lastly, we produced LoS displacement time series from our InSAR results at two specific locations: Lachambre and Faulquemont (points 4 and 5, respectively, in Fig. 3), respectively. For both time series, we observe a first stable period until mid-2018. Displacement is then detected Fig. 5. e and f. For both places, cumulative displacement reaches 10–15 mm in the LoS direction between mid-2018 and the end of 2019. At Lachambre, the displacement starts shortly after the replacement of the pumping equipment of the CBM production well. However, the selected pixel is also located above a shallow-depth pumping station for freshwater supply. Thus, it is not possible to decipher whether the detected displacement was caused by the CBM production test, or by the freshwater pumping.
At Faulquemont, displacement begins shortly after the expansion of an underground anhydrite quarry, at a depth of 80 m. The selected pixels are located more than 500 m away from the quarry, whose influence area should not exceed a distance of 100 m. Thus, the displacements detected close to Faulquemont cannot be explained directly by the new underground excavation. It might be caused by another phenomenon, such as the pumping needed for the extension works.
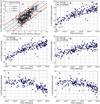 |
Fig. 5 Comparison between mean LoS velocities derived from levelling measurements and InSAR results (a), and between LoS displacement time series from levelling and InSAR at Rosbruck (b), Freyming-Merlebach (c), Creutzwald (d), Lachambre (e), and Faulquemont (f). Comparaisons entre les vitesses moyennes selon la ligne de visée du satellite déduites des mesures de nivellement et des résultats InSAR (a), et entre les séries temporelles de déplacements selon la ligne de visée du satellite des mesures de nivellement et des résultats InSAR à Rosbruck (b), Freyming-Merlebach (c), Creutzwal (d), Lachambre (e) et Faulquemont (f). |
5 Discussion
5.1 Uplift induced by the progressive flooding of mine panels
Surface displacement induced by mine flooding in the post-mining phase had been monitored over the last decades, and since 1961 in Lorraine by Charbonnages de France (the former coal mining company). In contrast to mining subsidence that occurs during operations, uplift induced by flooding only occurs once the flooding has started. The first mention of this phenomenon dates back to the 1990’s in the southern Limbourg, Netherlands (Bekendam and Pöttgens 1995). The authors reported a cumulative uplift of about 25 cm above mined-out panels at a maximum depth of 800 m, and suggested a plausible correlation between the cumulated mining subsidence and the cumulated uplift. Since then, various cases have been reported as mines have ceased activity, such as in the UK (Gee et al., 2017) and Poland (Blachowski et al., 2019). In the southern Limbourg (Netherlands), previous observations have been improved by the use of radar interferometry over the period 1992-2010 (Caro Cuenca et al., 2013). Cumulative uplift reaches 20 cm over this period, but their amplitude is heterogeneous throughout the area, depending on the underneath exploitation characteristics (size and depth of mined panels) and the possible presence of faults. According to the results, the vertical velocity reaches about 10 mm/yr at some locations, even 15 years after the end of the pumping operations. According to water level monitoring, flooding was still in progress at the end of the study period. At locations where both displacement and water level are measured, a vertical velocity of 4 mm/yr is detected when the water level rise is approximately 2.3 m/yr. In the Campine basin (Belgium), where mined panels lie between 350 and 850 m in depth, surface displacements are well documented after the pumping operations ended in 1992 (Vervoort and Declercq 2018; Vervoort 2021a). In the same area, uplift extent is unevenly distributed across the region. The vertical velocity reaches about 21 mm/yr at specific locations up to 7–8 years after the onset of the flooding. This vertical velocity decreases to 9 mm/yr at these locations 10 years later. However, no data on the evolution of the water level with time is available.
In the Lorraine coalfield, the exploitation was separated in two parts in the South sector: Folshwiller and Bambiderstroff. The flooding has started in 1980 at Folschwiller and in 1990 at Bambiderstroff Table 2, i.e., 35 and 25 years, respectively before the beginning of our period of study. Mined panels in both Folschwiller and Bambiderstroff sectors have been completely flooded within 2 years and overlying areas are stable over the period under study. In contrast, the flooding is still progressing in the West, East and Centre sectors (Table 2). The water level change is faster in the Centre and East sectors than in the West sector, and the mine depth was greater in the East and Centre sectors. Both factors—water-level rise rate and mine depth—may partially explain the velocity difference between the sectors. When compared with observations from Belgium and the Netherlands, the uplift rates observed in the East and Centre sectors are similar. Nevertheless, this comparison should be interpreted with caution since geological and mining characteristics are quite different. Lastly, mined-out panels close to Saarbrücken are not flooded, which explains the presence of subsidence in the German sector.
The accumulation of observations on uplifts induced by mines flooding gives a more precise idea of the final amplitude of the uplift. But it only provides little information on the mechanisms causing it. Recent publications investigate the behavior and the evolution of caved areas due to flooding, such as the physicochemical swelling of the goaf or the reduction of the vertical stress, to explain the uplift (Dudek et al., 2020; Vervoort 2021b). Some models help to anticipate the expected final uplift in areas with complex geology (Zhao and Konietzky 2020). Researchers use all available data, in particular surface displacements obtained by InSAR and the evolution of water levels, to calibrate numerical models.
Thus, the study of uplift induced by mine flooding is in constant progress. This progress is based on new observations, which allow to test hypotheses through modelling, and we believe that our new observations will contribute to ongoing advancements in the field.
Summary of information on flooding in the Lorraine coalfield. Regarding the sector West, 30 % of the void volume have been flooded from 2001 to 2006; i.e., before the end of the exploitation.
Résumé des données d’ennoyage dans le bassin houiller lorrain. Concernant le secteur Ouest, 30 % des vides miniers ont été ennoyés entre 2001 et 2006, soit avant la fin de l’exploitation.
5.2 Surface displacements related to CBM extraction
So far, very few studies have investigated potential surface displacements induced by CBM extraction. The few available studies are based on the use of radar interferometry in the USA, China, and in Australia. Moreover, these studies do not agree on the interpretation of the observations. In the USA, studies regarding Wyoming, Colorado and New Mexico coalfields, where coal seam depth ranges from 450 to 1100 m, show the occurrence of surface displacement close to CBM exploitation (Grigg et al., 2012; Katzenstein 2012). In China, authors report an absence of correlation between surface displacement and CBM exploitation for shallower coal seams, at depths less than 200 m (Du et al., 2018). In Australia, two studies using the same archive of radar images reach opposite conclusions for coal seams located between 200 and 600 m deep. In the first study, the authors conclude that there is no correlation between surface displacement and CBM extraction, since velocities between −8 and +8 mm/yr in the LoS direction are associated with stable areas (Duro et al., 2012). In the second study, the authors show the occurrence of displacements ranging from −10 to +10 mm/yr in the LoS direction, concluding on the impact of CBM extraction on surface displacements (Moghaddam et al., 2016). Moreover, in the same area, the cumulative subsidence induced by CBM exploitation reaches 9 cm (Hummel et al., 2021). These observations have been used to calibrate a subsidence model and to estimate the volumetric deformation of underground coal layers related to the extraction process (Hummel et al., 2021; Moghaddam et al., 2021).
Our study did not provide conclusive evidence regarding the existence or absence of correlation, between surface displacement and CBM extraction tests. The presence of fields and forests mainly explains this result. Considering this being a test phase, the amplitude of the induced displacement could also be too small. The processing of an archive of ALOS-2 SAR images, a L-band satellite, may help clarify the presence or absence of this correlation, since L-band SAR images are more suitable in case of dense vegetation cover (Raucoules et al., 2007). The CBM exploitation project was authorized by the French government in November 2023 and up to 400 drillings are planned within the concession. Other locations in the concession could be better suited for surface displacement monitoring using radar interferometry with Sentinel-1 SAR images. A surface displacement monitoring program should be implemented, as done in Australia (Garthwaite et al., 2015), to clarify the potential relation between surface displacement and CBM extraction activities.
6 Conclusions
After processing Sentinel-1 SAR images using the PS-InSAR method, surface displacements were detected at different locations across the former Lorraine coalfield over the period from November 2014 to January 2020. Our results highlight the occurrence of uplift affecting a large area up to 13 years after flooding of the mined-out panels began. A comparison to available levelling measurements confirms this conclusion. The uplift rate decreases over time, although its termination cannot yet be predicted. Surface displacement also appears related to the underground water level rising. Thus, our results provide new data necessary to characterise the impacts of mine flooding. These results could support refinement of hydrogeomechanical modelling studies of the phenomenon at the basin scale or to assess potential civil engineering hazards.
Regarding the CBM exploitation test, our InSAR results are inconclusive regarding the possible relationship between surface displacement and CBM production. In order to assess the potential impact on surface displacement of CBM extraction, processing of additional SAR datasets and local geomechanical modelling should be considered. Depending on the development of the project, a large-scale surface displacement monitoring program should be considered. Subsidence is also detected close to an anhydrite quarry. In this case, the surface displacement may be linked to pumping activity.
This study demonstrates that the current surface displacement map reflects past and present operations in the underground, and can inform potential future developments, in case new operations are started.
Acknowledgement
The authors are grateful to the GeoRessources laboratory for its encouraging support and trust. The authors are grateful to the anonymous reviewers for their constructive comments on the manuscript. SAR images were provided by ESA.
Funding
This study was conducted within the framework of the research and development project Regalor (“Ressources Gazières de Lorraine”, https://regalor.univ-lorraine.fr) carried out by GeoRessources laboratory (Université de Lorraine—CNRS) on Grand-Est region’s initiative and supported by the European Regional Development Fund.
References
- Alheib M, Nicolas M, Noirel JF, Wojtkowiak F. 2005. Residual subsidence analysis after the end of coalmine work. Example from Lorraine colliery, France. Symposium Post mining 2005, Nov 2005, Nancy, France. pp.NC. ineris-00972515. [Google Scholar]
- Amelung F, Galloway DL, Bell JW, et al. 1999. Sensing the ups and downs of Las Vegas: InSAR reveals structural control of land subsidence and aquifer-system deformation. Geology 27: 483–486. https://doi.org/10.1130/0091-7613(1999)027<0483:STUADO>2.3.CO;2. [CrossRef] [Google Scholar]
- Bawden GW, Thatcher W, Stein RS, et al. 2001. Tectonic contraction across Los Angeles after removal of groundwater pumping effects. Nature 412: 812–815. https://doi.org/10.1038/35090558. [CrossRef] [Google Scholar]
- Bekendam RF, Pöttgens JJ. 1995. Ground movements over the coal mines of southern Limburg, the Netherlands, and their relation to rising mine waters. In: Fifth International Symposium on Land Subsidence, The Hague, p. A377. [Google Scholar]
- Blachowski J, Kopec A, Milczarek W, Owczarz K. 2019. Evolution of secondary deformations captured by satellite radar interferometry: Case study of an abandoned coal basin in SW Poland. Sustainability 11: 884. https://doi.org/10.3390/su11030884. [CrossRef] [Google Scholar]
- Bürgmann R, Rosen PA, Fielding EJ. 2000. Synthetic aperture radar interferometry to measure Earth’s surface topography and its deformation. Annual Review of Earth and Planetary Sciences 28: 169–209. https://doi.org/10.1146/annurev.earth.28.1.169. [CrossRef] [Google Scholar]
- Caro Cuenca M, Hooper AJ, Hanssen RF. 2013. Surface deformation induced by water influx in the abandoned coal mines in Limburg, The Netherlands observed by satellite radar interferometry. Journal of Applied Geophysics 88: 1–11. https://doi.org/10.1016/j.jappgeo.2012.10.003. [CrossRef] [Google Scholar]
- Declercq P-Y., Walstra J, Gérard P, et al. 2017. A study of ground movements in Brussels (Belgium) monitored by Persistent Scatterer Interferometry over a 25-year period. Geosciences 7: 115. https://doi.org/10.3390/geosciences7040115. [CrossRef] [Google Scholar]
- Donsimoni M. 1981. Le bassin houiller lorrain. Synthèse géologique. BRGM [Google Scholar]
- Doubre C, Meghraoui M, Masson F, et al. 2021. Seismotectonics in Northeastern France and neighboring regions. Comptes Rendus Géoscience 353: 1–33. https://doi.org/10.5802/crgeos.80. [Google Scholar]
- Doumergue Y. 1962. Dans les houillères de Lorraine: une technique d’exploitation unique au monde, les «dressants» de Merlebach. Ingeo 26: 177–182. https://doi.org/10.3406/ingeo.1962.2179. [CrossRef] [Google Scholar]
- Du Z, Ge L, Ng AH-M., et al. 2018. Monitoring of ground deformation in Liulin district, China using InSAR approaches. International Journal of Digital Earth 11: 264–283. https://doi.org/10.1080/17538947.2017.1322151. [CrossRef] [Google Scholar]
- Dudek M, Tajduś K, Misa R, Sroka A. 2020. Predicting of land surface uplift caused by the flooding of underground coal mines − a case study. International Journal of Rock Mechanics and Mining Sciences 132: 104377. https://doi.org/10.1016/j.ijrmms.2020.104377. [CrossRef] [Google Scholar]
- Duro J, Albiol D, Sabater J. 2012. InSAR baseline ground motion study of the Surat and Bowen Basins. Tre Altamira. [Google Scholar]
- Farr TG, Kobrick M. 2000. Shuttle radar topography mission produces a wealth of data. Eos Transactions AGU 81: 583. https://doi.org/10.1029/EO081i048p00583. [CrossRef] [Google Scholar]
- Fleck S, Michels R, Izart A, et al. 2001. Palaeoenvironmental assessment of Westphalian fluvio-lacustrine deposits of Lorraine (France) using a combination of organic geochemistry and sedimentology. International Journal of Coal Geology 48: 65–88. https://doi.org/10.1016/S0166-5162(01)00048-9. [CrossRef] [Google Scholar]
- Foumelis M, Delgado Blasco JM, Desnos Y-L, et al. 2018. ESA SNAP − StaMPS integrated processing for Sentinel-1 Persistent Scatterer Interferometry. In: IGARSS 2018–2018 IEEE International Geoscience and Remote Sensing Symposium, Valencia. IEEE, pp. 1364–1367. [Google Scholar]
- Garthwaite MC, Hazelwood M, Nancarrow S, et al. 2015. A regional geodetic network to monitor ground surface response to resource extraction in the northern Surat Basin, Queensland. Australian Journal of Earth Sciences 62: 469–477. https://doi.org/10.1080/08120099.2015.1040073. [CrossRef] [Google Scholar]
- Gee D, Bateson L, Sowter A, et al. 2017. Ground motion in areas of abandoned mining: application of the Intermittent SBAS (ISBAS) to the Northumberland and Durham Coalfield, UK. Geosciences 7: 85. https://doi.org/10.3390/geosciences7030085. [CrossRef] [Google Scholar]
- Grigg KM, Katzenstein KW, Davis AD. 2012. Using InSAR technology and groundwater pumping data to model land subsidence from coal bed methane production in the Powder River Basin, Wyoming. In: Rocky Mountain Section Meeting, Geological Societyof America, Albuquerque, p. 67 [Google Scholar]
- Guéguen Y, Deffontaines B, Fruneau B, et al. 2009. Monitoring residual mining subsidence of Nord/Pas-de-Calais coal basin from differential and Persistent Scatterer Interferometry (Northern France). Journal of Applied Geophysics 69: 24–34. https://doi.org/10.1016/j.jappgeo.2009.02.008 [CrossRef] [Google Scholar]
- Hamm V, Bazargan Sabet B. 2010. Modelling of fluid flow and heat transfer to assess the geothermal potential of a flooded coal mine in Lorraine, France. Geothermics 39: 177–186. https://doi.org/10.1016/j.geothermics.2010.03.004. [CrossRef] [Google Scholar]
- Heimlich C, Gourmelen N, Masson F, et al. 2015. Uplift around the geothermal power plant of Landau (Germany) as observed by InSAR monitoring. Geothermal Energy 3: 2. https://doi.org/10.1186/s40517-014-0024-y. [CrossRef] [Google Scholar]
- Hooper A, Bekaert D, Spaans K, Arıkan M. 2012. Recent advances in SAR interferometry time series analysis for measuring crustal deformation. Tectonophysics 514-517: 1–13. https://doi.org/10.1016/j.tecto.2011.10.013. [CrossRef] [Google Scholar]
- Hooper A, Segall P, Zebker H. 2007. Persistent scatterer interferometric synthetic aperture radar for crustal deformation analysis, with application to Volcán Alcedo, Galápagos. Journal of Geophysical Research 112: B07407. https://doi.org/10.1029/2006JB004763. [CrossRef] [Google Scholar]
- Hooper A, Zebker HA. 2007. Phase unwrapping in three dimensions with application to InSAR time series. Journal of the Optical Society of America A 24: 2737. https://doi.org/10.1364/JOSAA.24.002737. [CrossRef] [Google Scholar]
- Hummel N, Rai UB, Dudley JW, et al. 2021. Unlocking methane desorption effects in reservoir compaction and subsidence computations for a coal seam gas development. In: 82nd EAGE Annual Conference & Exhibition, European Association of Geoscientists & Engineers, Amsterdam, The Netherlands, pp. 1–5. [Google Scholar]
- Izart A, Palain C, Malartre F, et al. 2005. Paleoenvironments, paleoclimates and sequences of Westphalian deposits of Lorraine coal basin (Upper Carboniferous, NE France). Bulletin de la Société Géologique de France 176: 301–315. https://doi.org/10.2113/176.3.301. [CrossRef] [Google Scholar]
- Katzenstein KW. 2012. InSAR identifies subsidence resulting from coalbed methane production in the San Juan Basin, Colorado and New Mexico. In: Rocky Mountain Section Meeting, Geological Society of America, Albuquerque, p. 95. [Google Scholar]
- Ketelaar VBH. 2009. Satellite radar interferometry: subsidence monitoring techniques. Springer Science + Business Media, New York, 266 p. [Google Scholar]
- Korsch RJ, Schäfer A. 1995. The Permo-Carboniferous Saar-Nahe Basin, south-west Germany and north-east France: basin formation and deformation in a strike-slip regime. Geologische Rundschau 84: 293–318. https://doi.org/10.1007/BF00260442. [CrossRef] [Google Scholar]
- Kratzsch H. 1983. Mining subsidence engineering. Springer Berlin Heidelberg, Berlin, Heidelberg, 543 p. [Google Scholar]
- Liu S, Harpalani S. 2013. A new theoretical approach to model sorption-induced coal shrinkage or swelling. Bulletin 97: 1033–1049. https://doi.org/10.1306/12181212061. [CrossRef] [Google Scholar]
- Massonnet D, Feigl KL. 1998. Radar interferometry and its application to changes in the Earth’s surface. Reviews of Geophysics 36: 441–500. https://doi.org/10.1029/97RG03139. [CrossRef] [Google Scholar]
- Modeste G, Doubre C, Masson F. 2021. Time evolution of mining-related residual subsidence monitored over a 24-year period using InSAR in southern Alsace, France. International Journal of Applied Earth Observation and Geoinformation 102: 102392. https://doi.org/10.1016/j.jag.2021.102392. [CrossRef] [Google Scholar]
- Moghaddam NF, Nourollah H, Vasco DW, et al. 2021. Interferometric SAR modelling of near surface data to improve geological model in the Surat Basin, Australia. Journal of Applied Geophysics 194: 104444. https://doi.org/10.1016/j.jappgeo.2021.104444. [CrossRef] [Google Scholar]
- Moghaddam NF, Samsonov SV, Rüdiger C, Baillie C, Garthwaite M, Smyley R. 2016. Multi-temporal SAR observations of the Surat Basin in Australia for deformation scenario evaluation associated with man-made interactions. Environ Earth Sci 75: 282. https://doi.org/10.1007/s12665-015-4864-y. [CrossRef] [Google Scholar]
- Pijnenburg RPJ, Verberne BA, Hangx SJT, Spiers CJ. 2019. Inelastic deformation of the Slochteren Sandstone: Stress‐strain relations and implications for induced seismicity in the Groningen Gas Field. J Geophys Res Solid Earth 124: 5254–5282. https://doi.org/10.1029/2019JB017366. [CrossRef] [Google Scholar]
- Raucoules D, Colesanti C, Carnec C. 2007. Use of SAR interferometry for detecting and assessing ground subsidence. Comptes Rendus Geoscience 339: 289–302. https://doi.org/10.1016/j.crte.2007.02.002. [CrossRef] [Google Scholar]
- Samsonov S, d’Oreye N, Smets B. 2013. Ground deformation associated with post-mining activity at the French-German border revealed by novel InSAR time series method. Int. J. Appl. Earth Obs. Geoinf. 23: 142–154. https://doi.org/10.1016/j.jag.2012.12.008. [Google Scholar]
- Smith JD, Avouac J, White RS, et al. 2019. Reconciling the long‐term relationship between reservoir pore pressure depletion and compaction in the Groningen region. J. Geophys. Res. Solid Earth 124: 6165–6178. https://doi.org/10.1029/2018JB016801. [CrossRef] [Google Scholar]
- Vervoort A. 2021a. Uplift of the surface of the earth above abandoned coal mines. Part A: Analysis of satellite data related to the movement of the surface. Int. J. Rock Mech. Min. Sci. 104896. https://doi.org/10.1016/j.ijrmms.2021.104896. [CrossRef] [Google Scholar]
- Vervoort A. 2021b. Uplift of the surface of the earth above abandoned coal mines. Part B: Framework to understand and explain uplift. Int. J. Rock Mech. Min. Sci. 104947. https://doi.org/10.1016/j.ijrmms.2021.104947. [CrossRef] [Google Scholar]
- Vervoort A, Declercq P-Y. 2018. Upward surface movement above deep coal mines after closure and flooding of underground workings. Int. J. Min. Sci. Technol. 28: 53–59. https://doi.org/10.1016/j.ijmst.2017.11.008. [CrossRef] [Google Scholar]
- White CM, Smith DH, Jones KL, et al. 2005. Sequestration of carbon dioxide in coal with enhanced coalbed methane recovery — A review. Energy Fuels 19: 659–724. https://doi.org/10.1021/ef040047w. [CrossRef] [Google Scholar]
- Whittaker BN, Reddish DJ. 1989. Subsidence: occurrence, prediction and control. Amsterdam: Elsevier Science, 528 p. [Google Scholar]
- Zhao J, Konietzky H. 2020. Numerical analysis and prediction of ground surface movement induced by coal mining and subsequent groundwater flooding. Int. J. Coal Geol. 229: 103565. https://doi.org/10.1016/j.coal.2020.103565. [CrossRef] [Google Scholar]
Cite this article as: Modeste G, Gunzburger Y, Conin M, Diallo M. 2025. Surface displacements induced by underground activities from 2014 to 2019 in the former Lorraine coalfield, northeastern France BSGF - Earth Sciences Bulletin 196: 7. https://doi.org/10.1051/bsgf/2025006
All Tables
Synthetic geological log of the Lorraine coalfield.
Log synthétique du bassin houiller lorrain.
Summary of information on flooding in the Lorraine coalfield. Regarding the sector West, 30 % of the void volume have been flooded from 2001 to 2006; i.e., before the end of the exploitation.
Résumé des données d’ennoyage dans le bassin houiller lorrain. Concernant le secteur Ouest, 30 % des vides miniers ont été ennoyés entre 2001 et 2006, soit avant la fin de l’exploitation.
All Figures
|
Fig. 1 Schematic cross-section of a mining subsidence with Am the maximum central subsidence and γ the angle of influence, which is required to define the impacted surface area. Coupe schématique d’un affaissement minier avec Am l’affaissement maximal et γ l’angle d’influence, nécessaire pour définir l’aire en surface impactée par l’affaissement. |
| In the text | |
|
Fig. 2 Location map of the Lorraine coalfield. with Google Satellite imagery as the basemap. Bam.: Bambiderstroff; Ber.: Berwiller-en-Moselle; Car.: Carling; Cre.: Creutzwald; Fal.: Falck; Fol.: Folschviller; For.: Forbach; Fre.: Freyming-Merlebach; Gue.: Guerting; Ros.: Petite-Roselle; Sti.: Stiring-Wendel. Localisation et carte du bassin houiller lorrain avec en fond de carte, les vues aériennes de Google (Google Satellite). Bam.: Bambiderstroff; Ber.: Berwiller-en-Moselle; Car.: Carling; Cre.: Creutzwald; Fal.: Falck; Fol.: Folschviller; For.: Forbach; Fre.: Freyming-Merlebach; Gue.: Guerting; Ros.: Petite-Roselle; Sti.: Stiring-Wendel. |
| In the text | |
|
Fig. 3 Mean LoS velocity map for the period from November 2014 to December 2019. The red triangle and black points indicate location of the reference point used for the PS-InSAR processing and where LoS displacement time series have been realized, respectively. The brown polygons represent the zoomed-in areas in the inserts on the left. Carte de vitesses moyennes selon la ligne de visée du satellite sur la période de novembre 2014 à décembre 2019. Le triangle rouge et les points noirs indiquent la position du point de référence pour le traitement PS-InSAR et de déplacement, respectivement. Les polygones marron correspondent aux zones agrandies dans les encarts à gauche. |
| In the text | |
|
Fig. 4 (a) Mean LoS velocity map over the period November 2014–December 2017. (b) Mean LoS velocity map over the period January 2017–December 2019. The same colour bar was used to produce those two maps. (a) Carte de vitesses moyennes selon la ligne de visée du satellite sur la période novembre 2014–décembre 2017. (b) Carte de vitesses moyennes selon la ligne de visée du satellite sur la période janvier 2017–décembre 2019. La même barre de couleurs a été utilisée pour générer les deux cartes. |
| In the text | |
|
Fig. 5 Comparison between mean LoS velocities derived from levelling measurements and InSAR results (a), and between LoS displacement time series from levelling and InSAR at Rosbruck (b), Freyming-Merlebach (c), Creutzwald (d), Lachambre (e), and Faulquemont (f). Comparaisons entre les vitesses moyennes selon la ligne de visée du satellite déduites des mesures de nivellement et des résultats InSAR (a), et entre les séries temporelles de déplacements selon la ligne de visée du satellite des mesures de nivellement et des résultats InSAR à Rosbruck (b), Freyming-Merlebach (c), Creutzwal (d), Lachambre (e) et Faulquemont (f). |
| In the text | |
Current usage metrics show cumulative count of Article Views (full-text article views including HTML views, PDF and ePub downloads, according to the available data) and Abstracts Views on Vision4Press platform.
Data correspond to usage on the plateform after 2015. The current usage metrics is available 48-96 hours after online publication and is updated daily on week days.
Initial download of the metrics may take a while.