")
")
| Issue |
BSGF - Earth Sci. Bull.
Volume 196, 2025
|
|
|---|---|---|
| Article Number | 8 | |
| Number of page(s) | 16 | |
| DOI | https://doi.org/10.1051/bsgf/2025001 | |
| Published online | 29 mai 2025 | |
Inframillimetric slip rate and ∼8kyr long recurrence intervals for Mw ≥ 7.5 earthquakes along the southern section of the Har-Us-Nuur fault (Mongolian Altay)
Vitesse de glissement inframillimétrique et intervalles de récurrence de ∼8ka pour les séismes de Mw ≥ 7,5 le long de la section sud de la faille Har-Us-Nuur (Altai mongol)
1
Geosciences Montpellier, University of Montpellier − CNRS, Montpellier, France
2
Univ. Savoie Mont Blanc, Univ. Grenoble Alpes, CNRS, IRD, Univ. Gustave Eiffel, ISTerre. Le Bourget-du-Lac, France
3
Institute of Astronomy and Geophysics, Mongolian Academy of Sciences, Ulan Bator, Mongolia
4
Institute of the Earth Crust, Russian Academy of Sciences, Siberian Branch, Irkutsk, Russia
* Corresponding author: Cette adresse e-mail est protégée contre les robots spammeurs. Vous devez activer le JavaScript pour la visualiser.
Received:
25
October
2024
Accepted:
7
February
2025
Abstract
The Har-Us-Nuur fault corresponds to one of the longest (>500 km) strike-slip fault in Mongolian Altai. Although the fault clearly affects Quaternary deposits, no major instrumental or historical earthquake is associated to it and only a few morphotectonic and paleoseismological analyses have been carried out to date. In this paper, we analyze a previously undescribed surface rupture in the southern section of the Har-Us-Nuur fault along which we study a 20 km long section of it in detail. A morphotectonic analysis yielded a minimum slip rate of 0.32 ± 0.04 mm.yr−1, while paleosismological investigations suggest a mean recurrence interval of about 8.1 ± 3.4 kyr from the characterization of three surface rupturing events that occurred over the past 23 kyr. These preliminary results suggest that the Har-Us-Nuur fault slip rate is inframillimetric and therefore lower than previous published estimates. They also suggest that the fault is able to produce major earthquakes (Mw ≥7.5) separated by very long period of quiescence.
Résumé
La faille de Har-Us-Nuur est l’une des plus longues (>500 km) failles décrochantes de l’Altai mongol. Bien que la faille affecte clairement les dépôts quaternaires, aucun séisme instrumental ou historique majeur n’y est associé et seules quelques analyses morphotectoniques et paléosismologiques ont été réalisées à ce jour. Dans cet article, nous décrivons une nouvelle rupture de surface dans la section sud de la faille Har-Us-Nuur, le long de laquelle nous étudions en détail une section de 20 km de long. L’analyse morphotectonique permet d’estimer une vitesse de glissement minimale de 0,32 ± 0,04 mm.an−1, tandis que les investigations paléosismologiques suggèrent un intervalle de récurrence moyen d’environ 8,1 ± 3,4 ka à partir de la caractérisation de trois paléoruptures qui se sont produits au cours des derniers 23ka. Ces résultats préliminaires suggèrent que la vitesse de glissement de la faille de Har-Us-Nuur est inframillimétrique et donc inférieure aux estimations publiées précédemment. Ils suggèrent également que la faille est capable de produire des séismes majeurs (Mw ≥7,5) séparés par de très longues périodes de quiescence.
Key words: Mongolia / Altai / active fault / Har-Us-Nuur fault / slip rate / paleosesismology
Mots clés : Mongolie / Altai / Faille active / Faille Har-Us-Nuur / slip rate / paléosismologie
© F. Ramel et al., Published by EDP Sciences 2025
 This is an Open Access article distributed under the terms of the Creative Commons Attribution License (https://creativecommons.org/licenses/by/4.0), which permits unrestricted use, distribution, and reproduction in any medium, provided the original work is properly cited.
1 Introduction
The identification and study of former surface ruptures associated with major earthquakes are crucial to characterize active faults, understand their role in the deformation processes associated with the plate tectonics and to determine the seismic hazard they represent. In intraplate domains, this task is made more difficult given the fact that active faults are slower than in plate boundary domains. However, in some regions such as Central Asia, this kind of study is actually easier than in many other parts of the world. Indeed, the dry climate conditions and the large dimensions of the faults of this region favor the preservation of surface deformations. This is the case of Mongolia where large strike-slip faults are producing major (M≥7.5) earthquakes leaving outstanding fault traces in the landscape (e.g., Baljinnyam et al., 1993; Ritz et al., 1995; Kurushin et al., 1997; Walker et al., 2006; Rizza et al., 2015 Davaasambuu et al., 2022). The Altai reliefs in western Mongolia, exhibit several of such large right-lateral strike-slip faults which are intimately linked with the building process of these massifs. Altai reliefs are structured by four main fault systems (Har-Us-Nuur, Hovd, Olgy, and Fu-Yun fault), whose average slip rates are estimated to be between 1 and 2 mm.yr−1 (Vassalo, 2006; Walker et al., 2006; Nissen et al., 2009a, 2009b; Frankel et al., 2010; Xu et al., 2012; Gregory et al., 2014; Ha et al., 2023; Wu et al., 2024). One of these faults, the Fu-Yun fault produced Mw 8 earthquake in 1931, the first event of a four-event seismic cluster which occurred in the first part of the 20th century (Baljinnyam et al., 1993).
However, although the map of active faulting in Altai is relatively well known nowadays, the slip rate along the different large active faults and recurrence intervals separating strong earthquakes are unsufficiently constrained. In this article, we present the results of a morphotectonic and paleoseismological study along the southern Har-Us-Nuur fault (HUNF), the easternmost large active fault that bounds the Altai massif along which we observed outstanding Holocene surface rupture features.
From the geomorphological study, using 10Be dating, we estimate the minimum slip rate along the fault, while the excavation of two paleoseismological trenches including radiocarbon dating, allows us estimating mean recurrence interval for 5-6 m dislocation (Mw ≥7.5) considered as characteristic over the last 23 kyr. We discuss our results with respect to the structural segmentation of the HUNF and to the implications of these preliminary results in terms of slip rates and recurrence interval along the other active faults in Altai and in western Mongolia.
2 Tectonic setting
2.1 The altai massif and quaternary deformations in Western Mongolia
The Altai massif is located in western Mongolia, where it forms an orographic border with Russia, Kazakhstan, and China (Fig. 1). This transpressive mountain range is structured by large dextral strike-slip faults and thrust faults, which controlled the building of the relief (Cunningham et al., 1996, 2003, 2005; Tapponnier & Molnar, 1979). It is surrounded to the south by the Junggar Basin, to the east by the Gobi-Altai and the Hangai Dome, and to the north by the Siberian Platform. According to GPS measurements, the Altai region accommodates about 10 to 20% of the India-Asia shortening (Calais et al., 2003). This deformation is mainly accommodated along four main fault systems, namely from East to West the Har-Us-Nuur (HUN), Hovd, Olgy, and Fu-Yun faults.
The reactivation of ancient Paleozoic structures under the influence of India-Asia convergence is considered to be the driving force behind the current deformation of Altay (Cunningham et al., 1996, 2003, 2005; Tapponnier & Molnar, 1979). Depending on the authors, the initiation of deformations for the Gobi-Altai and Altai occurred between 5 Myr and 20 Myr ago (De Grave et al., 2007; De Grave & Van den Haute, 2002; Howard et al., 2003, 2006; Vassalo, 2006; Yuan et al., 2006). The dextral structures of the Altai and sinistral structures in the Gobi-Altai and Bolnai areas, as well as the extensive regime within the Baikal rift system, make the analysis of the kinematics of the actual deformations relatively complex (Fig. 1).
The Altai massif is considered an intracontinental transpressive mountain range, giving rise to morphologies associated with flower structures and the coalescence of fault segments over time (Cunningham et al., 1996). The chronology of deformations and resulting topography remain debated. According to Cunningham et al., 2003, the Altai is sandwiched between the Siberian and Hangai cratons to the north and the Junggar craton to the south. Nissen et al., 2009 and Gregory, 2012 have proposed that the Altay has widened over time through the reactivation and the progressive rotation of ancient structures bordering the massif. For them, the orientation of the HUN and Fu-Yun faults (330−347°), different from those in the interior of the range (314−330°), is a marker of this process.
Western Mongolia was affected by four strong earthquakes of magnitude Mw ≥ 8 over the 20th century (Baljinnyam et al., 1993), an exceptional seismicity, explained by a seismic clustering process (Chéry et al., 2001). This led to paleoseismological and geomorphological studies of the responsible structures, namely the Gobi Altai (Ritz et al., 1995; 2003; 2006; Prentice et al., 2002, Vassallo et al., 2006; Rizza et al., 2011; Kurtz et al., 2018)), Bolnay (Rizza et al., 2015; Choi et al., 2018) and Fu-Yun (Klinger et al., 2011, Fan et al., 2022) faults (Fig. 1). These studies have revealed slow fault slip rates (≈ 1 mm.yr−1) and mean return periods on the order of 3500–4000 yr for major earthquakes. At the Altai scale, two strong instrumental earthquakes are known: Fu-Yun (Mw=8 ; 1931) and Chuya (Mw=7,3; 2003), located respectively in the Chinese and Russian border zones.
Due to the arid climate and the coseismic displacements, surface deformations are exceptionally well preserved. The analysis of Altai satellite images have revealed numerous prehistoric surface ruptures in the recent decades. A cartographic synthesis was provided by Gregory, (2012), that is reproduced and complemented in Figure 1. The excavation of four paleoseismological trenches on the Hovd fault, along the Ar-Hötöl rupture, provided ages for the last earthquakes ranging from approximately 500 to 2000 cal BP (Davaasambuu et al., 2022), while a paleo-seismic event was dated between 870 and 980 yr ago by (Walker et al., 2006), on a fault segment to the north of HUNF.
With the development of 10Be and OSL dating methods over the past three decades (e.g., Ritz et al., 1995; Gosse & Phillips, 2001; Hu et al., 2024), morphotectonic studies have provided estimates of slip rates of the main Altai faults. Among these results, Nissen et al. (2009a) estimated an horizontal slip rate of 2.4 ± 0.4 mm.yr−1 for the last 75 kyr on the HUNF within the Jargalant massif, 100 km further North from our study area.
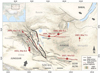 |
Fig. 1 Active faults and Holocene surface ruptures in western Mongolia. HUNF : Har-Us-Nuur Fault, HOVF : Hovd Fault, OF : Olgy Fault, SF : Sagsay Fault, FYF : Fu-Yun Fault. The thin black line corresponds to the Mongolian frontier. |
2.2 The Har-us-Nuur fault
The Har-Us-Nuur fault (HUNF) is a 500 km long dextral strike-slip fault, trending NW (330−347°; Fig. 2). It bounds the Altai massif to the East and separates the massif from the Great Lakes Valley, a large endorheic depression. Several changes in the strike of the fault are at the origin of transpressional relays where reliefs developed (Cunningham, 2005), some of which reaching 4000 m high. At the foothills of the reliefs, alluvial fan deposits cover the bedrock. Several recent surface ruptures affect these deposits, attesting to the fault’s activity (Fig. 2). Walker et al. (2006), focused on the “Jid” rupture, within the northernmost part of the HUNF and estimated a rupture length between 55 and 90 km. Measuring coseismic displacements comprised between 3.2 and 6.6 m, they proposed a maximum Moment magnitude for the Jid rupture of Mw 7.5. In addition, Walker et al. (2006) proposed a slip rate of 1 mm.yr−1 from offset alluvial fans supposed to date from the beginning of last interstadial period. On the basis of satellite images, Gregory, (2012) highlighted a small 8 km long surface rupture north of the Har-Us-Nuur lake, which they called “Jigjjig”. Nissen et al. (2009a) studied a 30 km long well preserved surface rupture along the eastern foothills of the Jargalant massif. From the analysis of cumulative displacements recorded within different generations of alluvial fans and their dating, they estimated maximum horizontal slip rate of 2.4 ± 0.4 mm.yr−1.
Finally, within the southernmost section of HUNF, Khil’ko et al. (1985) described in the 1980s a surface rupture near a fault called Tonhil fault. This rupture is about 25 km long. Khil’ko et al. (1985) proposed it occurred between 500 and 1000 yr ago.
 |
Fig. 2 Sketch map of the Quaternary fault traces along the HUNF, and published slip rate estimates. |
3 Slip rate and recurrence intervals of major surface-rupturing earthquakes along the southern HUNF
3.1 Study sites
We called the studied section of the HUNF, the Sutai rupture, after the name of the massif located immediately to the south (Fig. 3). In this area, the surface rupture extends over about twenty kilometers and runs along the western edge of the Sutai massif (Fig. 3), which was interpreted as a transpressive relay by Cunningham et al. (2003) (See Fig. 2). Along the studied section, the fault is primarily characterized by strike-slip displacement and is cutting through a large alluvial plain fed by the reliefs adjacent to the Sutai massif to the south (Fig. 3). We mapped the fault trace along 22 kilometers, along which fault scarps define quite distinctive features as mole tracks or shutter ridges (Fig. 4). Further south-east, the rupture can be followed along a less distinct 5 kilometers section before it enters into the reliefs.
Within the central part of the 22 km long section, the rupture is very well preserved along a 3 kilometers distance, where it crosses a northwest gently dipping flat abandoned fan surface. An alignment of two parallel series of about 30 m long, 20 m wide and more than a meter high mole tracks characterize the surface deformation along that section (Fig. 4a, b). A sort of gutter forming a central depression where fine deposits have been accumulated in several ponds lies between the two parallel mole tracks lines. This site was chosen for carrying out paleoseismological investigations (Fig. 4a; see Sect. 3.3). About 5 km further southeast, the fault cut through ancient alluvial surfaces incised by streams that are showing clear right-lateral cumulative offset (Fig. 4c). There we spotted an abandoned alluvial surface cut by the fault and showing well preserved offset risers (Fig. 4d).
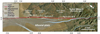 |
Fig. 3 ESRI image showing the HUNF within the northern part of the Sutai massif (see Fig. 2) and location of the study sites (small black rectangles are paleoseismological trenches). Red line: trace of well-preserved surface rupture; Red dashed line: trace of less well-preserved rupture. Black lines: Other potential active fault. |
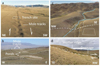 |
Fig. 4 a, b: Photographs of the Har-Us-Nuur fault scarp (car inside the trench site area for scale). c: Photographs of the offset surface studied for slip rate estimation (circle peoples for scale); white rectangles define the 10Be sampling areas; thick dashed line represents the fault trace; thin white dashed line materialize the right lateral offset. d: photograph showing the cumulative right lateral offset within a shutter riser. |
3.2 Slip rate determination
To determine the slip rate along the HUNF southern section, we carried out a morphotectonic analysis at the site “Dark cloud Creek” (Figs. 3 and 5). In this area, we selected the only site with a clear offset. The drains on either side are much more oblique to the fault, and their sinuosity makes it difficult to characterize their tectonic origin without ambiguity.
Figures 5a, b, c present the map of the topographic surfaces observed within the site and their associated drainages. We notice interplay between different sources of drainage that are joining to the northwest of the study area. The main drainage D1 is coming from a catchment basin located 4-5 km to the SE within the Sutai massif, and corresponds to one of the source of the main alluvial plain shown in Figure 3. The upstream surfaces where we carried out our study are associated with smaller drainages D2 and D3. Their origins are small catchment basins related to reliefs located immediately to the East that form a NW trending ridge extending from the Sutai massif (Fig. 3). The two main NW flooding drainages D1 and D2 generated alluvial terraces with gentle slopes (< 5°), while drainage D3 generated five levels of fan-terraces (T1-T5) with steeper slopes (approx. 5 − 10°, Fig. 5b). The influence of D2 cannot be totally excluded as concerns the formation of terrace T2D2-D3, given that it appears more or less parallel with D2. However, the curved geometry of T2D2-D3 / T3 riser suggests that the influence of D3 is predominant. The role of D3 in the formation of T1-T5 fan-terraces is also shown by the geometry of T1/T2D2-D3 riser within the northern bank, and T3/T4 riser within the southern bank, which are both parallel to D3. Given these observations, T3 is interpreted as ancient fan deposits that have been abandoned at the outlet of D3.
The T3 southern bank riser displays a clear right-lateral cumulative offset of more than 20 meters (Figs. 4c, d). Within T3 northern bank riser, the displacement is barely noticeable, which is explained by the NW direction of the drainage favoring the erosion (Fig. 5). Note here that in the absence of a well-defined terrace level below T3 on the southern bank, it is not possible to obtain the minimum age of the deformation. In this context, the T3 riser may have been eroded, reducing the amount of the cumulative offset. In the absence of a minimum age constraint, and given the measurement of a potentially reduced cumulative offset, we estimated a minimum slip rate.
Cumulative offset measurement − To measure precisely the cumulative right lateral offset, we built up a 20 cm resolution Digital Elevation Model (DEM) and orthophotograph from a drone survey and photogrammetric treatment. From the DEM, we computed a shaded map and a profile curvature map. We use those different representations of the studied area to identify piercing lines and points (e.g., Rizza et al., 2015, Fig. 6). For each type of treatment, we identify two piercing lines to mark the lower and upper limits of riser’s crest on either side of the fault. Given the resolution of our images and the relatively smoothed nature of the morphology, we consider an uncertainty of 5 m for the determination of piercing lines and points and associated offset measurements. The orthophotograph allows to observe color contrast due to light exposure, vegetation cover, colluvial deposits and slopes surfaces differences (Fig. 6a). For example, the riser appears darker and rougher than upper surface due to shade and the presence of fissures, respectively. Reconstructing the riser crest allows to measure an offset of about 24 m ± 5 m. The offset riser appears even more clearly with the shaded map (Fig. 6b). It highlights better crest areas affected by erosion, particularly upstream of the fault and in the first part downstream the fault. This shaded map allows to measure an offset of about 28 ± 5 m. The profile curvature map gives a representation of the concavity and convexity of the relief. The blue and red bands highlights here the slope breaks at the base and top of the riser and are used to define the piercing lines. This allows to measure an offset of 21 ± 5 m. From those measurements, an average of 24 ± 3 m is found.
10Be Dating − We used in situ-produced 10Be within quartz (Dunai, 2010; Lal, 1991) to estimate the abandonment age of T3 surface, and in turn determine the minimum slip rate along the fault (e.g., Ritz et al., 1995). The surface is vegetated with sparse grass, where angular centimetric clasts of various origins are found, with gravel matrix and including few clasts of quartz. This material is similar on the surface and in the drainage. We collected 2 amalgamated samples each consisting of about thirty quartz-rich clasts of similar sizes, approximately 2-3 cm, one for estimating the average 10Be concentration at the top of T3 surface (MO22B1), one within the present temporary active river bed (MO22B2) to estimate the average Inherited 10Be within the drainage bed load (e.g., Marechal et al., 2018). We assume here, based on our geomorphologic analysis (see Fig. 5), that the present drainage conditions are the same as at the time of the formation of T3 surface and that inherited 10Be in modern drainage material is representative of the pre-depositional concentration of the material found in T3. Although we can’t exclude that T3 has undergone erosion compared to present bed load we considered it’s age is a maximum for the offset. Therefore the current riverbed samples concentration is to be subtracted from the T3 obtained in order to provide the true exposure time of the terrace.
The chemical preparation of samples followed the LN2C protocol (Ruszkiczay-Rüdiger et al., 2021 and reference therein), the measurement were performed on the ASTER AMS facility (Arnold et al., 2010). All data regarding the measurement of 10Be concentrations and the parameters used for calculating an exposure age are compiled in Table 1. The online version3 CRONUS calculator was used for computing the ages (Balco et al., 2008; Marechal et al., 2016).
Being located at rather high elevation (c.a. 2000 m ASL) and mid latitude, the snow cover has to be considered. Using the current reported snow cover that doesn’t reach more than a few centimeters for a few months a year, and providing the fact that obtained ages are younger than the LGM (similar cm-scale snow thickness being therefore expected), we prefer not to correct the local production rate with unconstrained shielding factor. In any case, the total effect should not be less than a few percent of the total production rates, hence being comprised in the used uncertainties.
Measurements of MO22B1 and M022B2 samples yielded concentrations of 22.00 ± 4.3 105 at. g−1 and 7.3 ± 0.2 105 at. g−1, respectively. Subtracting the inherited concentration found in the bedload from the surface concentration in T3, yielded a corrected surface concentration for Surface T3 of 14.7 ± 0.5 105 at. g−1. This corresponds to an abandonment age of 75 ± 3,4 kyr.
Slip rate determination − A minimum slip rate along this section of the HUNF is obtained by dividing the measured offset estimates by the age of T3 surface (75 ± 3,4 kyr). Using the preferred offset estimate of 24 ± 3 m we obtain a minimum slip rate of 0.32 mm.yr−1 ± 0.04 mm.yr−1.
 |
Fig. 5 Morphotectonic analysis of the studied site (“Dark cloud Creek”) and its series of alluvial terraces. a: Satellite image (PLEIADE). b: Slope map. c: Map of alluvial terraces (T) and associated drainages (D). d: Topographic profiles showing the relations between alluvial surfaces and drainages. When the label of terraces do not specify their relationship with their genetic drain, these terraces are associated with drain D3. Fault is materialized by the white dashed line. |
 |
Fig. 6 Morphotectonic reconstruction of the offset surface at Dark cloud creek site. a, orthophotograph, b, shaded map and c, profile curvature map. For clarity of representation, the color scale of the profile curvature map is saturated in gray for extreme values. Lines and circles are piercing lines and points used to measure offsets. Dashed lines are projections of piercing lines on the fault. Note that, owing to the curved geometry of the upstream riser, due to erosion, the piercing line is restricted to the part of the riser that aligns most closely with the direction of the drainage. |
Measurements of 10Be concentrations, parameters used for exposure age calculations and ages.
3.3 Recurrence intervals of surface-rupturing events
As shown in Figure 3, we carried out paleoseismological investigations at two different sites. The two trenches, named “Changing Wind (CW) and “Stubborn Beetle” (SB), were excavated approximately 5 km apart on ancient alluvial fans associated with the reliefs located immediately to the east (Figs. 3, 4a, b, and 7).In the CW trench site, the fault crosses a northwest gently dipping flat ancient fan surface where remnant bare and swales morphology are observable (Fig. 7b). In the southernmost part of the area, recent rupture trace is erased by erosion due to active fan (Fig. 7b). The trench was excavated within the central depression located between the two parallel mole tracks lines which are interpreted as the morphological expression of several surface rupturing events (Figs. 4a and 8).
The surface crossed by the fault is relatively well-preserved from erosion. It is made of ancient coarse alluvium interpreted as deposits associated with debris flows that formed the fan. In addition, within the central depression located between the mole tracks, we observed ponded areas containing fine-grained deposits. Here, we excavated a trench measuring 15 m long, 2 m deep, and 1 m wide (Fig. 8).
The CW trench (Fig. 9) reveals a dominance of coarse, poorly-sorted, and poorly-rounded deposits, indicative of high-energy depositional processes, associated locally to fluvial channels deposits. The occurrence of calcretes at the base of the larger clasts provides insights into clast orientation during deposition and subsequent tilting due to deformations and ruptures. Fractures and ruptures are highlighted by calcium carbonate deposition along them. An important feature of the trench is a triangle-shape unit made of loess deposits that covers the western half of underlying coarse units within a depression zone. Using radiocarbon dating and calculating individual Cal BP ages with the online OxCal software (Tab. 2) we identified three paleoruptures listed as follow:
-
The first event is characterized by several fault strands (red faults) that cut through the unit 20 (see insert 3, Fig. 9), which corresponds to a ponded unit associated to an earlier event (see below). The faults are underlined by calcium carbonate, with some oriented clasts, and lithological contrasts from one side to another that emphasize their expression. Faults are observed from the bottom of the trench to the base of the modern soil unit U10, which defines the most recent event horizon (MRE). Using radiocarbon dating on bulk samples (Tab. 2), we bracketed this first event between 1930 and 790 yr cal BP.
-
As mentioned above, the second event (penultimate) is characterized by a triangle-shape loess unit, 5 meters wide at its top, 50 cm at its base and more than 1 m thick, which corresponds to a post-event ponded unit. We interpret its deposition associated to a ponded depression controlled by tension gash feature underneath centered on F3 faults system (that were reactivated afterwards, during the MRE). The deformation associated with this event (E2) is also observed in the center of the trench at the eastern end of depositional unit 20, which seals a small branch of F6 fault. Faults 8, 9 and 10 could also be associated with the 2nd event, which would be quite logical given the large depression associated with the F3 fault system. This intense deformation is therefore expressed across the entire width of the trench through fractures, offsets features, and folds (see insert 1, Fig. 9). In the western part of the trench, unit U30 appears disrupted with decreasing thickness. Below unit 20, clasts in unit U30 appear more spaced and embedded in a fine-grained matrix mixing sand, silt and loess . We interpret this feature as the expression of the dismantlement of unit U30 during the second event. Given the absence of unit 20 in the eastern half of trench, we cannot exclude that faults 8, 9 and 10 were also reactivated during MRE. The differential offset observed in the top of U40 and in U50 in particular on fault F8 support this interpretation. Using radiocarbon dating of bulk samples, we bracketed this penultimate event between 9730 and 7580 yr cal BP.
-
Finally, a third event is observed in three fault zones (F4, F5, and F7) affecting units U60 and U50, and which terminates below the base unit U40. It is also observed along the main branch of F6 fault where the base of U20 is offset. The most outstanding feature is found within F7 where we see oriented clasts within a twenty centimeters shear band (see insert 2, Fig. 9). Radiocarbon dating of bulk samples allowed bracketing this pre-penultimate event between 11940 and 22960 yr cal BP.
We opened the second trench SB within a site where we observed a ∼ 5 m offset within two young debris cones (Fig. 10b, see Fig. 3 for location). Figure 11 shows the trench southeastern wall, which expose homogenous deposits mainly made of fine gravels and sandy lenses. Stratification is difficult to see. Nevertheless we observe horizontal small lenses made of finer grained deposits that are cut by one fault crossing the trench from its bottom to its top. Only one event is observed. We collected several bulk samples within the upper part of the trench. Their radiocarbon analysis shows a consistent age stratigraphy and allows concluding that the last event affecting the deposits occurred after 1520 yr cal BP. We note that this age constraint postdating the only event observed in trench SB is consistent with the age constraints obtained within trench CW where the MRE is dated between 1930 and 790 yr cal BP.
Recurrence intervals of surface-rupturing events − Figure 12 presents the distribution of age constraints for the 4 events characterized in the 2 trenches CW and SB. After this distribution, it is reasonable to consider that the MRE event observed in CW trench corresponds to the MRE (E1) observed in SB trench. This allows bracketing the last surface rupturing event along this section of the southern HUNF between 1520 yr cal BP (MO22-T1-S04) and 790 yr cal BP (MO22-T2-C5). The two other events characterized from our paleoseismological investigations are only observed in CW trench and their ages are bracketed between 9730 yr cal BP (MO22-T2-C10) and 7580 yr cal BP (MO22-T2-C3) for the penultimate event (E2) and between 11940 yr cal BP (M022-T2-C11) and 22960 yr cal BP (MO22-T2-C15) for the pre-penultimate event (E3). Considering the interval of around 23 kyr separating the three events observed in the trench allow us to estimate a mean return period of 8.1 ± 3.4 kyr.
Note that the large uncertainties calculated for the 2 time intervals (Fig. 12), particularly between E2 and E3, can be explained by the fact that the position of the samples (C10 and C15), both predating the penultimate and pre-penultimate events, respectively, is low in the stratigraphy relative to the event boundaries (see Fig. 9). Indeed, we point out that the minimum interval of 2.2 kyr found between E2 and E3 is probably greater as the sample that pre-dates E2 is surmounted by two thick units (U40 and U30). Similarly, the maximum interval of 15.4 kyr is probably smaller as the sample that pre-dates E3 is surmounted by unit U50.
Estimating magnitude from the latest coseismic offset − As mentioned above, we observed two right-lateral offsets of about 5 m within two debris cones that we interpreted as the last coseismic displacements associated with the most recent surface–rupturing event. High resolution remote sensing helps pointing out these displacements that are visible within the northwestern sides of the debris cones characterized by light tone sediments and bushy vegetation (Fig. 10b). These cones are related to minor local drainages associated to the erosion of small granitic hills a few hundred meters upslope. The cones are made of an arenitic detrital material resulting from successive phases of deposition with some parts that are offset whereas others are not. The morphotectonic features are very subtle to interpret notably due to the lack of topography (the fault zone is clearly visible from some distance in the satellite imagery but much more difficult to see in the field). It is only once we logged the trench that we were convinced that a rupture was reaching the surface at some places (ancient deposits with sparse vegetation on it), while some other places with more recent deposits are covering the fault and are not deformed. The right-lateral offset of the smaller cone to the NW is easier to characterize than that of the larger cone to the SE. Within this last one, tracks left by motorcycles have blurred the original morphology. Moreover, this cone has experienced more intense post-deposition modifications (new sedimentary supplies). Using three piercing lines (the northeastern borders of both debris cones plus the border of a drainage underlined by a vegetation patch within the center of the larger cone) allow bracketing the offset between 5 and 6 meters (Fig. 10b). Note that we observe the same amount of offset (about 5 m), in some other places, sparsely along the fault north and south of the study area.
Considering these values as maximum and mean displacements, respectively, and using Wells and Coppersmith statistical functions (1994), we determined a Moment Magnitude comprised between Mw 7.4 and 7.8.
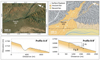 |
Fig. 7 Satellite view, sketch map of Changing wind trench site and topographic profile analysis. Profile A-A’ highlights the slope of the ancient fan. Profile B-B’ show local topography (mole track and pond) associated to the fault and vertical component of the deformation is underlined by slope projection (dashed lines) of hanging wall and footwall of the fault. |
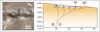 |
Fig. 8 High resolution drone image showing microtopography and morphotectonic characteristics of CW trench site (left). Interpreted section integrating surface deformations and trench observations (right). The surface topography and deformations observed in trench suggest a partitioning of deformation with a transpressive strike slip zone and a thrust zone at the origin of mole tracks (MT) and surficial opening in the center with pounded area (PA). Trench location is materialized by the rectangle. Main faults observed in trench and described on Figure 9 are shown on the section. |
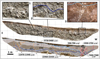 |
Fig. 9 Photomosaic and interpreted log of Changing wind paleosismological trench. Caption : U10: brown modern soil containing a few clay and roots; U20: unstratified loess unit with a few clay and a few centimetric clasts of variable size; U30: Unit with numerous unsorted centimetric to decimetric clasts, poorly rolled, with gravelly-sandy matrix; U40: Poorly stratified and poorly consolidated gravelly unit with centimetric clasts and fluvial sandy lenses; U41: consolidated and carbonated silty-sandy unit; U50. Poorly consolidated, unsorted unit with numerous centimetric to decimetric clasts into a gravelly-sandy matrix (similar to U40); U60: Poorly stratified clastic unit (few centimetric clasts) in an abundant brown sandy-silty matrix. Faults are chronologically ordered from ancient (yellow) to recent ones (red). Blues lines are event horizons. All dates are cal BP ages. |
Radiocarbon (14C) dates.
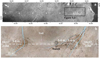 |
Fig. 10 a: Pleiades image showing the fault trace of the HUNF within the northwestern-most part of our study area; white triangles point out the fault trace. The black frame corresponds to Figure 10b. b: Orthophotograph taken from a drone survey detailing the fault trace within offset young cones debris. The white dashed transparent line defines the fault zone (about 20 m width). Blue lines represents active drainage and abandoned drainages (dashed), the latter are offset and used with the points as piercing lines and points respectively. Note the moto-trail track more or less parallel to the fault trace perturbing the morphotectonic analysis. The black rectangle corresponds to the trench called Stubborn Beetle (SB). |
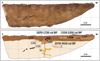 |
Fig. 11 Photomosaic and interpreted log of Stubborn Beetle paleoseismological trench . Caption : U10 : Soil, U20 : Silty unit with few small pebbles. U30 : Fine gravel unit with silt matrix. U40 : Sandy silt unit, U50 : Gravelly unit with sandy matrix. SL : Offset sandy lenses. C : Chanel deposit. Red line materialize the rupture. Dark brown patches are burrows. |
 |
Fig. 12 Ages of paleoevents at the Changing Wind (CW) and Stubborn Beattle (SB) trenches. Blue and red arrows define the minimum and maximum intervals between each event with associated time (kyr). The grey band combines the age constraints in the two trenches and represents the time interval during which the most recent event (E1) occurred. |
3.4 Estimating the magnitude from fault segmentation and surface rupture lengths
Characterizing the surface rupture length and the segmentation of active faults is essential to assess their seismogenic potential and estimate the magnitude of earthquakes. Analyzing in great details satellite images along the HUNF, we have been able to characterize qualitatively the state of preservation of the fault trace. Figure 13 shows the southern HUNF from the Jargalant massif to the Sutai massif and classifies whether the fault can be considered as having produced a Holocene surface rupture or not. Depending on the state and continuity of the rupture through the landscape, we distinguish 3 categories :
-
A first one where the rupture is cutting continuously through all morphological surfaces, including the most recent fans (c, d, e, f, g). This rupture corresponds to the latest surface rupturing event during the Holocene. For instance, to the south of the Sutai massif, three segments totalizing 50 km in length and connected to the south are characterized by the occurrence of bands of vegetation clearly highlighting the recent rupture (see example in Fig. 13f). We also found evidence for a clear young rupture through the alignment of mole tracks over 3 kilometers within the alluvial plain NW of the Sutai massif (study area, Fig. 13e). Further North, few other recent fault scarps are observed at the foothills of the Bumbat massif (Fig. 13c, d).
-
A second category where the rupture is observable but it is not clear whether it affects or not the latest fans (Fig. 13g). In this case, the rupture could have occurred earlier in the Holocene or in the upper part of the Upper Pleistocene.
-
A third category where it is clear that no surface rupture was produced during the Holocene (Fig. 13b). This classification led us to propose that the latest surface rupturing event was extending from the southeastern part of the Sutai massif to the southern part of the Bumbat Massif (see the light blue band underlying the fault traces in Fig. 13a). Note that within the Sutai massif, several more or less parallel strands would have ruptured contemporaneously.
These observations reveal a strong variability in the nature of the deformations (mole tracks, tension cracks, fissures, escarpments, etc.), and of the degree of preservation of surface rupture or of the slip distribution. However, if we consider the best-preserved rupture traces on either side of the study area to the north and south, we estimate a rupture length of about 150 km for the latest surface rupture. This yields a Moment magnitude Mw of 7.6 after Wells and Coppersmith functions (1994).
 |
Fig. 13 a: Map of active faults and Holocene latest surface ruptures along the southern section of HUNF; b, c, d, e, f, g are satellite pictures showing different state of preservation of the HUNF fault trace in the landscape (locations in Fig. 13a). |
4 Discussion − Conclusion
Our morphotectonic and paleoseismological study suggests that the southern section of the Har Us Nuur fault has a slip rate lower than 1 mm.yr−1, while it is capable of generating earthquakes of Mw ≥ 7.5 separated by long recurrence intervals of ∼ 8 kyr. Our morphotectonic study yielded a minimum slip rate of 0.32 ± 0.04 mm.yr−1. This value is lower than those previously estimated by Walker et al. (2006) (∼1 mm.yr−1) and Nissen et al. (2009a) (2.4 ± 0.4 mm.yr−1) along the northern and central sections of the HUNF, respectively. However, direct comparison of these results is not straightforward given that the slip rate estimated by Nissen et al. (2009a) corresponds to a maximum value and is estimated along another fault segment of the HUNF, while Walker et al. (2006)’s estimate does not lie on absolute dating.
The fault segmentation within the southern Har-Us-Nuur fault could explain the low slip rate. Indeed, our analysis of the fault trace reveals that it is quite eroded, which is consistent with a very long recurrence intervals for surface rupturing earthquakes. There are good similarities between our observations and results (smoothed fault scarp, last even comprised between 790 and 1520 yr, last co-seismic offset of 5–6 m, and an estimated magnitude Mw and length of ∼ 7.6 and 150 km, respectively) and those obtained by Walker et al. (2006) along the Jid fault (smoothed and discontinuous fault trace), last event dated between 870 and 980 yr, last coseismic displacement comprised between 3.2 and 6.6 m, and an estimated magnitude Mw and length of 7.5 and 90 km, respectively).
On the other hand our study is located in a complex area where the Sutai and Baatar massifs connect with an other active fault system called Zereg which is located in between and corresponds to a wide complex compressional structure (see Fig. 13, Nissen et al., 2009b). In comparison, Nissen et al. (2009a) study, is located within a much simpler tectonic setting along a single fault strand (i.e the central HUNF) located at the foothills of the Jargalant massif. Therefore, we can wonder to what extent the Zereg compressional system absorbs part of the deformation, which in turn, would explain the low slip rate along the southern section of the HUNF. Paleoseismological investigations along the reverse fault systems of the Zereg basin, as well as along the central HUNF would certainly help to better understand the distribution of the active deformations and the fault slip rates along the different structures.
Nissen et al. (2009a); Gregory (2012); Gregory et al. (2018) point out the resemblance between the HUNF and the Fu-Yun fault due to their similar orientation. These authors suggest that their orientation (HUNF and Fu-Yun fault, 330−347°), different from the other faults in the Altai massif (314−330°), may be an indicator of a more recent activity, in the hypothesis of a gradual widening of the range over time. Our results and those, comparable, obtained along the Fu-Yun fault by Xu et al. (2012) (i.e., average slip rate of 0.76 ± 0.24 mm.yr−1, mean recurrence interval of 9700 ± 3300 yr) or by Wu et al. (2024) (i.e., average slip rate of 1.0 +0.4/-0.1mm.yr−1) support this assertion.
Finally, the low slip rates and particularly the long recurrence intervals of large surface rupturing events along the southern HUNF, combined with the fact that these characteristics also seem to define other Altai faults such as the Fu-Yun fault, suggest that the active deformations are more distributed in the Altai, than in other western Mongolia active regions (Gobi-Altai, Bolnay) where recurrence intervals of large events are shorter (3.5–4 kyr).
Acknowledgments
This study was carried out in the framework of the CNRS 2023-2024 International Emerging Action (IEA) proposal «ALTAY» (Analysis and modeling the active tectonics in Altay; PI J-F. Ritz). The authors thank the IAG logistical and technical support that was provided during the field trips. They also thank the technical staff of the Laboratory Geosciences Montpellier (Harald Ruffer, Yves Sinquin) and the LN2C Aster team in CEREGE (Centre de Recherche et d’Enseignement en Géosciences de l’Environnement, (Regis Braucher, Laetitia Leanni, Georges Aumaitre, Karim Keddadouche, Fawzi Zaidi)) for their help in preparing samples, and in performing Be10 concentration analyses, respectively. Authors are also greatly indebted to the LMC14 (Laboratoire de Mesure du Carbone 14, (J-P. Dumoulin and his team)) in Gif-sur-Yvettes for their careful analysis of the bulk samples collected in the trenches. We are thankful for the comments and corrections made by the two anonymous reviewers.
References
- Arnold, M., Merchel, S., Bourl`es, D. L., Braucher, R., Benedetti, L., Finkel, R. C., Aumaitre, G., Gottdang, A., and Klein, M. 2010. The French Accelerator Mass Spectrometry ASTER: Improved Performance and Developments. Nuclear Instruments and Methods in Physics Research Section B: Beam Interactions with Material and Atoms 268: 1954–59. https://doi.org/10.1016/j.nimb.2010.02.107 [Google Scholar]
- Baljinnyam I, Bayasgalan A, Borisov BA, Cisternas A, Dem’yanovich MG, Ganbaatar L, et al. 1993. Ruptures of major earthquakes and active deformation in Mongolia and its surroundings. Geol Soc Am Mem 181: 1–60. Geological Society of America. https://doi.org/10.1130/MEM181-p1 [Google Scholar]
- Balco G, Stone JO, Lifton NA, Dunai TJ. 2008. A complete and easily accessible means of calculating surface exposure ages or erosion rates from 10Be and 26Al measurements. Quat Geochronol 3 (3): 174–195. https://doi.org/10.1016/j.quageo.2007.12.001 [CrossRef] [Google Scholar]
- Calais E, Vergnolle M, San’kov V, Lukhnev A, Miroshnitchenko A, Amarjargal S, et al. 2003. GPS measurements of crustal 682deformation in the Baikal-Mongolia area (1994-2002): Implications for current kinematics of Asia. Journal of Geophysical Research, 108, 2501-2513. https://doi.org/10.1029/2002JB002373 [CrossRef] [Google Scholar]
- Chéry J, Carretier S, Ritz J-F. 2001. Postseismic stress transfer explains time clustering of large earthquakes in Mongolia. Earth Planet Sci Lett 194(1‑2): Art. 1–2. https://doi.org/10.1016/S0012-821X(01)00552-0 [CrossRef] [Google Scholar]
- Choi J, Klinger Y, Ferry M, Ritz J, Kurtz R, Rizza M, et al. 2018. Geologic Inheritance and earthquake rupture processes: The 1905 M ≥ 8 Tsetserleg‐Bulnay strike‐slip earthquake sequence, Mongolia. J Geophys Res: Solid Earth 123 (2): 1925–1953. https://doi.org/10.1002/2017JB013962 [CrossRef] [Google Scholar]
- Cunningham D. 2005. Active intracontinental transpressional mountain building in the Mongolian Altai: Defining a new class of orogen. Earth Planet Sci Lett 240 (2): Art. 2. https://doi.org/10.1016/j.epsl.2005.09.013 [Google Scholar]
- Cunningham D, Dijkstra Arjan H, Howard J, Quarles A, Badarch G. 2003. Active intraplate strike-slip faulting and transpression uplift in the Mongolian Altai. Geol Soc Spec Publ 210: 65–87. [CrossRef] [Google Scholar]
- Cunningham D, Windley BF, Dorjnamjaa D, Badamgarov G, Saandar M. 1996. A structural transect across the Mongolian Western Altai: Active transpressional mountain building in central Asia. Tectonics 15: 142–156. https://doi.org/10.1029/95TC02354 [CrossRef] [Google Scholar]
- Davaasambuu B, Ferry M, Ritz J-F, Munkhuu U. 2023. The Ar-Hötöl surface rupture along the Khovd fault (Mongolian Altay), Journal of Maps, 19(1), 2132884. https://doi.org/10.1080/17445647.2022.2132884 [CrossRef] [Google Scholar]
- De Grave J, Buslov MM, haute P. 2007. Distant effects of India-Eurasia convergence and Mesozoic intracontinental deformation in Central Asia: Constraints from apatite fission-track thermochronology. J Asian Earth Sci 29: 188–204. https://doi.org/10.1016/j.jseaes.2006.03.001 [CrossRef] [Google Scholar]
- De Grave J, Van den Haute P. 2002. Denudation and cooling of the Lake Teletskoye Region in the Altai Mountains (South Siberia) as revealed by apatite fission-track thermochronology. Tectonophysics 349 (1): 145–159. https://doi.org/10.1016/S0040-1951(02)00051-3 [CrossRef] [Google Scholar]
- Dunai T. 2010. Cosmogenic nuclides. Principles, concepts and applications in the earth surface sciences. Cosmogenic Nuclides: Principles, Concepts and Applications in the Earth Surface Sciences, 1–187. https://doi.org/10.1017/CBO9780511804519 [CrossRef] [Google Scholar]
- Fan J, Xu H, Shi W, Guo Q, Zhang S, Wei X, et al. 2022. A ̃28-kyr continuous lacustrine paleoseismic record of the intraplate, slow-slipping Fuyun fault in Northwest China. Front Earth Sci 10. https://www.frontiersin.org/articles/10.3389/feart.2022.828801 [Google Scholar]
- Frankel KL, Wegmann KW, Bayasgalan A, Carson RJ, Bader NE, Adiya T, et al. 2010. Late Pleistocene slip rate of the Höh Serh-Tsagaan Salaa fault system, Mongolian Altai and intracontinental deformation in central Asia: Mongolian Altai late Pleistocene slip rate. Geophys J Int 183 (3): Art. 3. https://doi.org/10.1111/j.1365-246X.span>2010.04826.x [Google Scholar]
- Gosse JC, Phillips FM. 2001. Terrestrial in situ cosmogenic nuclides: Theory and application. Quat Sci Rev 20 (14): 1475–1560. https://doi.org/10.1016/S0277-3791(00)00171-2 [CrossRef] [Google Scholar]
- Gregory LC. 2012. Active faulting and deformation of the Mongolian Altai Mountains [Ph.D., University of Oxford]. http://ora.ox.ac.uk/objects/uuid:4bbed5b2-4597-4faa-b08c-c182d148c152 [Google Scholar]
- Gregory LC, Thomas AL, Walker RT, Garland R, Mac Niocaill C, Fenton CR, et al. 2014. Combined uranium series and 10Be cosmogenic exposure dating of surface abandonment: A case study from the Ölgiy strike-slip fault in western Mongolia. Quat Geochronol 24: 27–43. https://doi.org/10.1016/j.quageo.2014.07.005 [CrossRef] [Google Scholar]
- Gregory LC, Mac Niocaill C, Walker RT, Bayasgalan G, Craig TJ. 2018. Vertical axis rotation (or lack thereof) of the eastern Mongolian Altai Mountains: Implications for far-field transpressional mountain building. Tectonophysics 736: 31–46. https://doi.org/10.1016/j.tecto.2018.03.020 [CrossRef] [Google Scholar]
- Ha, S., Seong, Y. B., & Son, M. (2023). Tectonic geomorphology and Quaternary fault slip rates in the Tsambagarav Massif, Mongolian Altai. Earth Surface Processes and Landforms, 48 (2023), pp. 1428-1449. https://doi.org/10.1002/esp.5558 [CrossRef] [Google Scholar]
- Howard JP, Cunningham WD, Davies SJ. 2006. Competing processes of clastic deposition and compartmentalized inversion in an actively evolving transpressional basin, Western Mongolia. J Geol Soc 163 (4): 657–670. https://doi.org/10.1144/0016-764904-073 [CrossRef] [Google Scholar]
- Howard JP, Cunningham WD, Davies SJ, Dijkstra AH, Badarch G. 2003. The stratigraphic and structural evolution of the Dzereg Basin, western Mongolia: Clastic sedimentation, transpressional faulting and basin destruction in an intraplate, intracontinental setting. Basin Res 15 (1): 45–72. https://doi.org/10.1046/j.1365-2117.2003.00198.x [CrossRef] [Google Scholar]
- Hu G, Liu-Zeng J, Shao Y, Qin K, Gao Y. 2024. The applications of optically stimulated luminescence dating in active fault and paleo-earthquake studies: A review. Quat Int 688, 53-62. https://doi.org/10.1016/j.quaint.2024.01.016 [CrossRef] [Google Scholar]
- Khil’ko, S. D., R. A. Kurushin, V. M. Kochetkov, I. Balzhinnyam, and D. Monkoo (1985), Strong earthquakes, paleoseismogeological and macroseismic data, in Earthquakes and the bases for seismic zoning of Mongolia, Transactions, vol. 41, pp. 19{83, The Joint Soviet-Mongolian Scientic Geological Research Expedition: Moscow, Nauka. [Google Scholar]
- Klinger Y, Etchebes M, Tapponnier P, Narteau C. 2011. Characteristic slip for five great earthquakes along the Fuyun fault in China. Nat Geosci 4: 389–392. https://doi.org/10.1038/ngeo1158 [CrossRef] [Google Scholar]
- Kurtz R, Klinger Y, Ferry M, Ritz J-F. 2018. Horizontal surface-slip distribution through several seismic cycles: The Eastern Bogd fault, Gobi-Altai, Mongolia. Tectonophysics 734–735: 167–182. https://doi.org/10.1016/j.tecto.2018.03.011 [CrossRef] [Google Scholar]
- Kurushin RA, Bayasgalan A, Ölziybat M, Enhtuvshin B, Molnar P, Bayarsayhan Ch, et al. 1997. The surface rupture of the 1957 Gobi-Altai, Mongolia, Earthquake. In Kurushin RA, Bayasgalan A, Ölziybat M, Enhtuvshin B, Molnar P, Bayarsayhan Ch, Hudnut KW, Lin J. eds. The Surface Rupture of the 1957 Gobi-Altai, Mongolia, Earthquake. Geological Society of America. Vol. 320, p. 0. https://doi.org/10.1130/0-8137-2320-5.1 [Google Scholar]
- Lal D. 1991. Cosmic ray labeling of erosion surfaces: In situ nuclide production rates and erosion models. Earth Planet Sci Lett 104 (2): 424–439. https://doi.org/10.1016/0012-821X(91)90220-C [CrossRef] [Google Scholar]
- Marechal A, Ritz J-F., Ferry M, Mazzotti S, Blard P-H., Braucher R, et al. 2018. Active tectonics around the Yakutat indentor: New geomorphological constraints on the eastern Denali, Totschunda and Duke River Faults. Earth Planet Sci Lett 482: 71–80. https://doi.org/10.1016/j.epsl.2017.10.051 [CrossRef] [Google Scholar]
- Marrero SM, Phillips FM, Borchers B, Lifton N, Aumer R, Balco G. 2016. Cosmogenic nuclide systematics and the CRONUScalc program. Quat Geochronol 31: 160–187. https://doi.org/10.1016/j.quageo.2015.09.005 [CrossRef] [Google Scholar]
- Nissen E, Walker RT, Bayasgalan A, Carter A, Fattahi M, Molor E, et al. 2009a. The late quaternary slip-rate of the Har-Us-Nuur fault (Mongolian Altai) from cosmogenic 10Be and luminescence dating. Earth Planet Sci Lett 286(3–4): Art. 3–4. https://doi.org/10.1016/j.epsl.2009.06.048 [Google Scholar]
- Nissen E, Walker R, Molor E, Fattahi M, Bayasgalan A. 2009b. Late quaternary rates of uplift and shortening at Baatar Hyarhan (Mongolian Altai) with optically stimulated luminescence. Geophys J Int 177 (1): 259–278. https://doi.org/10.1111/j.1365-246X 2008.04067.x [CrossRef] [Google Scholar]
- Prentice CS, Kendrick K, Berryman K, Bayasgalan A, Ritz JF, Spencer JQ. 2002. Prehistoric ruptures of the Gurvan Bulag fault, Gobi Altai, Mongolia. J Geophys Res: Solid Earth 107(B12): Art. B12. https://doi.org/10.1029/2001JB000803 [CrossRef] [Google Scholar]
- Ritz JF, Brown ET, Bourlès DL, Philip H, Schlupp A, Raisbeck GM, et al. 1995. Slip rates along active faults estimated with cosmic-ray-exposure dates: Application to the Bogd fault, Gobi-Altaï, Mongolia. Geology 23 (11): 1019–1022. https://doi.org/10.1130/0091-7613(1995)023<1019:SRAAFE>2.3.CO;2 [CrossRef] [Google Scholar]
- Ritz J-F., Bourlès D, Brown ET, Carretier S, Chéry J, Enhtuvshin B, et al. 2003. Late Pleistocene to Holocene slip rates for the Gurvan Bulag thrust fault (Gobi-Altai, Mongolia) estimated with 10Be dates. J Geophys Res: Solid Earth 108(B3). https://doi.org/10.1029/2001JB000553 [Google Scholar]
- Ritz J-F., Vassallo R, Brown E, Carretier S, Bourlès D. 2006. Using in situ-produced 10 Be to quantify active tectonics in the Gurvan Bogd mountain range (Gobi-Altai, Mongolia). In: Situ-Produced Cosmogenic Nuclides and Quantification of Geological Processes, 415. https://doi.org/10.1130/2006.2415(06) [Google Scholar]
- Rizza M, Ritz J‐F, Prentice C, Vassallo R, Braucher R, Larroque C, et al., & ASTER Team. 2015. Earthquake geology of the Bulnay fault (Mongolia). Bull Seismol Soc Am 105 (1): Art. 1. https://doi.org/10.1785/0120140119 [Google Scholar]
- Rizza M, Ritz J-F., Braucher R, Vassallo R, Prentice C, Mahan S, et al. 2011. Slip rate and slip magnitudes of past earthquakes along the Bogd left-lateral strike-slip fault (Mongolia). Geophys J Int 186 (3): 897. https://doi.org/10.1111/j.1365-246X.2011.05075.x [CrossRef] [Google Scholar]
- Ruszkiczay-Rüdiger, Z., Kern, Z., Urdea, P., Madarász, B., & Braucher, R. (2021). Limited glacial erosion during the last glaciation in mid-latitude cirques (Retezat Mts, Southern Carpathians, Romania). Geomorphology, 384, 107719. https://doi.org/10.1016/j.geomorph.2021.107719 [CrossRef] [Google Scholar]
- Tapponnier P, Molnar P. 1979. Active faulting and cenozoic tectonics of the Tien Shan, Mongolia, and Baykal Regions. J Geophys Res: Solid Earth 84(B7): 3425–3459. https://doi.org/10.1029/JB084iB07p03425 [CrossRef] [Google Scholar]
- Vassalo R. 2006. Chronologie et évolution des reliefs dans la région Mongolie-Sibérie: Approche morphotectonique et géochronologique. [Google Scholar]
- Walker RT, Bayasgalan A, Carson R, Hazlett R, McCarthy L, Mischler J, et al. 2006. Geomorphology and structure of the Jid right-lateral strike-slip fault in the Mongolian Altai mountains. J Struct Geol 28 (9): 1607–1622. https://doi.org/10.1016/j.jsg.2006.04.007 [CrossRef] [Google Scholar]
- Wu C, Huang K, Yin A, Zhang J, Zuza AV, Haproff PJ, et al. 2024. Tectonic geomorphology and Quaternary slip history of the Fuyun fault, southwestern Altai Mountains, central Asia. Geosphere 20 (3): 735–748. https://doi.org/10.1130/GES02737.1 [CrossRef] [Google Scholar]
- Xu X, Sun X-Z., Tan X, Li K, Yu G, Etchebes M, et al. 2012. Fuyun fault: Long-term faulting behavior under low crustal strain rate. Dizhen Dizhi 34: 606–617. https://doi.org/10.3969/j.issn.0253-4967.2012.04.007 [Google Scholar]
- Yuan W, Carter A, Dong J, Bao Z, An Y, Guo Z. 2006. Mesozoic Tertiary exhumation history of the Altai Mountains, northern Xinjiang, China: New constraints from apatite fission track data. Tectonophysics 412: 183–193. https://doi.org/10.1016/j.tecto.2005.09.007 [CrossRef] [Google Scholar]
Cite this article as: Ramel F, Ritz J-F, Ferry M, Malcles O, Davaasambuu B, Arzhannikova AV, Arzhannikov S, Chebotarev A, Danzansan E, Ayush D, Munkhuu U, Demberel S. 2025. Inframillimetric slip rate and ∼8kyr long recurrence intervals for Mw ≥ 7.5 earthquakes along the southern section of the Har-Us-Nuur fault (Mongolian Altay), BSGF - Earth Sciences Bulletin 196, 8. https://doi.org/10.1051/bsgf/2025001
All Tables
Measurements of 10Be concentrations, parameters used for exposure age calculations and ages.
All Figures
|
Fig. 1 Active faults and Holocene surface ruptures in western Mongolia. HUNF : Har-Us-Nuur Fault, HOVF : Hovd Fault, OF : Olgy Fault, SF : Sagsay Fault, FYF : Fu-Yun Fault. The thin black line corresponds to the Mongolian frontier. |
| In the text | |
|
Fig. 2 Sketch map of the Quaternary fault traces along the HUNF, and published slip rate estimates. |
| In the text | |
|
Fig. 3 ESRI image showing the HUNF within the northern part of the Sutai massif (see Fig. 2) and location of the study sites (small black rectangles are paleoseismological trenches). Red line: trace of well-preserved surface rupture; Red dashed line: trace of less well-preserved rupture. Black lines: Other potential active fault. |
| In the text | |
|
Fig. 4 a, b: Photographs of the Har-Us-Nuur fault scarp (car inside the trench site area for scale). c: Photographs of the offset surface studied for slip rate estimation (circle peoples for scale); white rectangles define the 10Be sampling areas; thick dashed line represents the fault trace; thin white dashed line materialize the right lateral offset. d: photograph showing the cumulative right lateral offset within a shutter riser. |
| In the text | |
|
Fig. 5 Morphotectonic analysis of the studied site (“Dark cloud Creek”) and its series of alluvial terraces. a: Satellite image (PLEIADE). b: Slope map. c: Map of alluvial terraces (T) and associated drainages (D). d: Topographic profiles showing the relations between alluvial surfaces and drainages. When the label of terraces do not specify their relationship with their genetic drain, these terraces are associated with drain D3. Fault is materialized by the white dashed line. |
| In the text | |
|
Fig. 6 Morphotectonic reconstruction of the offset surface at Dark cloud creek site. a, orthophotograph, b, shaded map and c, profile curvature map. For clarity of representation, the color scale of the profile curvature map is saturated in gray for extreme values. Lines and circles are piercing lines and points used to measure offsets. Dashed lines are projections of piercing lines on the fault. Note that, owing to the curved geometry of the upstream riser, due to erosion, the piercing line is restricted to the part of the riser that aligns most closely with the direction of the drainage. |
| In the text | |
|
Fig. 7 Satellite view, sketch map of Changing wind trench site and topographic profile analysis. Profile A-A’ highlights the slope of the ancient fan. Profile B-B’ show local topography (mole track and pond) associated to the fault and vertical component of the deformation is underlined by slope projection (dashed lines) of hanging wall and footwall of the fault. |
| In the text | |
|
Fig. 8 High resolution drone image showing microtopography and morphotectonic characteristics of CW trench site (left). Interpreted section integrating surface deformations and trench observations (right). The surface topography and deformations observed in trench suggest a partitioning of deformation with a transpressive strike slip zone and a thrust zone at the origin of mole tracks (MT) and surficial opening in the center with pounded area (PA). Trench location is materialized by the rectangle. Main faults observed in trench and described on Figure 9 are shown on the section. |
| In the text | |
|
Fig. 9 Photomosaic and interpreted log of Changing wind paleosismological trench. Caption : U10: brown modern soil containing a few clay and roots; U20: unstratified loess unit with a few clay and a few centimetric clasts of variable size; U30: Unit with numerous unsorted centimetric to decimetric clasts, poorly rolled, with gravelly-sandy matrix; U40: Poorly stratified and poorly consolidated gravelly unit with centimetric clasts and fluvial sandy lenses; U41: consolidated and carbonated silty-sandy unit; U50. Poorly consolidated, unsorted unit with numerous centimetric to decimetric clasts into a gravelly-sandy matrix (similar to U40); U60: Poorly stratified clastic unit (few centimetric clasts) in an abundant brown sandy-silty matrix. Faults are chronologically ordered from ancient (yellow) to recent ones (red). Blues lines are event horizons. All dates are cal BP ages. |
| In the text | |
|
Fig. 10 a: Pleiades image showing the fault trace of the HUNF within the northwestern-most part of our study area; white triangles point out the fault trace. The black frame corresponds to Figure 10b. b: Orthophotograph taken from a drone survey detailing the fault trace within offset young cones debris. The white dashed transparent line defines the fault zone (about 20 m width). Blue lines represents active drainage and abandoned drainages (dashed), the latter are offset and used with the points as piercing lines and points respectively. Note the moto-trail track more or less parallel to the fault trace perturbing the morphotectonic analysis. The black rectangle corresponds to the trench called Stubborn Beetle (SB). |
| In the text | |
|
Fig. 11 Photomosaic and interpreted log of Stubborn Beetle paleoseismological trench . Caption : U10 : Soil, U20 : Silty unit with few small pebbles. U30 : Fine gravel unit with silt matrix. U40 : Sandy silt unit, U50 : Gravelly unit with sandy matrix. SL : Offset sandy lenses. C : Chanel deposit. Red line materialize the rupture. Dark brown patches are burrows. |
| In the text | |
|
Fig. 12 Ages of paleoevents at the Changing Wind (CW) and Stubborn Beattle (SB) trenches. Blue and red arrows define the minimum and maximum intervals between each event with associated time (kyr). The grey band combines the age constraints in the two trenches and represents the time interval during which the most recent event (E1) occurred. |
| In the text | |
|
Fig. 13 a: Map of active faults and Holocene latest surface ruptures along the southern section of HUNF; b, c, d, e, f, g are satellite pictures showing different state of preservation of the HUNF fault trace in the landscape (locations in Fig. 13a). |
| In the text | |
Current usage metrics show cumulative count of Article Views (full-text article views including HTML views, PDF and ePub downloads, according to the available data) and Abstracts Views on Vision4Press platform.
Data correspond to usage on the plateform after 2015. The current usage metrics is available 48-96 hours after online publication and is updated daily on week days.
Initial download of the metrics may take a while.