")
")
| Issue |
BSGF - Earth Sci. Bull.
Volume 197, 2026
|
|
|---|---|---|
| Article Number | 8 | |
| Number of page(s) | 18 | |
| DOI | https://doi.org/10.1051/bsgf/2026004 | |
| Published online | 24 avril 2026 | |
Reconstructing alpine massifs paleoaltimetry using stable isotopic composition of fluid inclusions in quartz veins
Reconstruire la paléoaltimétrie de massifs alpins à partir de la composition isotopique d’inclusions fluides de veines de quartz
1
LGL-TPE UMR 5276, Université Lyon 1, ENS Lyon, 69622 Villeurbanne, France
2
ISA UMR 5280, Université Lyon 1, ENS Lyon, 69622 Villeurbanne, France
3
Géosciences Montpellier, Université de Montpellier, CNRS, 34094 Montpellier, France
* Corresponding author: Cette adresse e-mail est protégée contre les robots spammeurs. Vous devez activer le JavaScript pour la visualiser.
Received:
28
March
2025
Accepted:
26
February
2026
Abstract
We collected quartz veins and meteoric waters at alike altitudes on the Mont Blanc and the Chenaillet massifs in the French Alps to reconstruct the paleoaltimetry of these massifs. We analyzed 17 modern meteoric waters in total; the isotopic ratios of the MBM samples show a negative correlation with sample elevation defining a linear trend varying from the low values (δ2H = −144.3‰; δ18O = −18‰) at high elevation (3759 m) to higher values (δ2H = −33.3 ‰; δ18O = −4.9‰) at lower altitudes (1200 m) comparable to the Global Meteoric Water Line. The isotopic composition of Chenaillet samples collected at elevations ranging from 2160 to 2600 meters showed lower dispersion, with δ18O values ranging from −11.8‰ to −15.9‰ and δ2H values ranging from −83 ‰ to −108.1 ‰. The quartz veins from the Mont Blanc massif (MBM) and the Chenaillet massif (CM) used in this work cements tectonic fissures formed during compressive or extensive events associated with the exhumation of the massifs.
To recover the water from quartz FIs and obtained their isotopic composition, we used two distinct extraction methods (thermal decrepitation and crushing) and two distinct analytical methods (the conventional one: equilibration/reduction and the one developed in this study combining H and O analysis). Three separate laboratories, the LGL-TPE and ISA in Lyon and the CRPG in Nancy performed the analyses. The FIs contained in the quartz of the MBM provide δ18O values ranging from −5 ‰ to −10.5 ‰ and δ2H values ranging from −33 ‰ to −76 ‰. The FIs from the CM have an isotopic composition ranging from −6.4 to −16.9% for the δ18O values and from −83 ‰ to −120.3 ‰ for the δ2H values. The results indictae that the water in the FIs is meteoric in origin. The presence of adularia associated with quartz in the MBM samples allow to date the formation of the veins between 14 and 11 Ma. Based on data from the literature, we suggest an age of 22 Ma for the formation of the veins in the CM. A comparison of the isotopic compositions of the FIs waters with modern precipitations suggests that the MBM was at low elevation (between 0 and 1156 m) during the Middle Miocene, while the CM was already uplifted at an elevation between 2250 m and 3750 m. Finally, we demonstrate that H and O analysis of aqueous fluid inclusions from quartz veins is an effective method for mountain range paleo-altimetry reconstruction.
Résumé
Nous avons collecté des eaux météoriques et des veines de quartz à des altitudes similaires sur les massifs du Mont Blanc (MBM) et du Chenaillet (CM) dans les Alpes françaises afin de reconstruire la paleoaltimétrie de ces deux massifs. Les rapports isotopiques de 17 eaux météoriques modernes échantillonnées sur le MBM montrent une corrélation négative avec l'altitude de l'échantillon et, définissent une tendance linéaire entre des valeurs basses (δ2H = −144.3 ‰; δ18O = −18 ‰) à haute altitude (3759 m) et des valeurs plus élevées (δ2H = −33,3 ‰; δ18O = −4,9 ‰) à des altitudes plus basses (1200 m) comparables à la droite des eaux météoriques. L'analyse isotopique des échantillons du CM collectés à des altitudes comprises entre 2160 et 2600 mètres révèle une dispersion moindre, avec des valeurs de δ18O entre −11,8‰ et −15,9‰ et du δ2H entre −83 ‰ à −108,1‰. Les veines de quartz du MBM et du CM analysées dans cette étude cimentent des structures tectoniques formées lors d'événements compressifs et extensifs associés à l'exhumation des massifs. Afin d’obtenir la composition isotopique de l’eau des inclusions fluides des quartzs, deux techniques d’extraction différentes (décrépitation thermique et broyage) et deux procédés analytiques distincts (méthode conventionnelle : équilibration/réduction et analyse combinée de l’H et l’O par la methode mise au point dans cette étude) ont été employés. Les analyses ont été éfféctué au LGL-TPE et à l’ISA à Lyon et au CRPG de Nancy. Les résultats révélent que l'eau des IFs est d'origine météorique. Les IFs des quartz du Mont Blanc fournissent des valeurs de δ18O allant de −5 ‰ à −10,5 ‰, et des valeurs du δ2H variant de −33 ‰ à −76 ‰. Les IFs du Chenaillet ont des valeurs du δ18O qui varient entre −6,4 et −16,9% et des valeurs de δ2H qui varient entre −83 ‰ et −120,3 ‰. Les veines de quartz du MBM ont été datées entre 14 et 11 Ma grace à la présence d’adulaire associés au quartz. Des données de la littérature nous permet de proposer un âge de 22 Ma pour la formation des fentes de quartz du CM. Les compositions isotopiques de l’eau des IFs comparées aux précipitations modernes suggèrent que le Mont Blanc était à basse altitude (entre 0 et 1156 m) au Miocène moyen, tandis que le Chenaillet était à une altitude proche de l'actuelle (entre 2250 m et 3750 m). Enfin, nous démontrons que l'analyse de la composition isotopique en H et O des inclusions fluides aqueuses de quartz provenant de fentes de tension est une méthode éfficace pour la reconstruction paleo-altimétrique des chaines de montagnes.
Key words: fluid inclusions / Quartz veins / Alps / paleo-altimetry / exhumation
Mots clés : inclusion fluide / veines de quartz / Alpes / paleo-altimétrie / exhumation
© V. Gardien et al., Published by EDP Sciences 2026
 This is an Open Access article distributed under the terms of the Creative Commons Attribution License (https://creativecommons.org/licenses/by/4.0), which permits unrestricted use, distribution, and reproduction in any medium, provided the original work is properly cited.
1 Introduction
Mountain belt formation (in terms of extent and height) has an impact on regional climate. Precipiations, for example, are affected by rapid uplift in mountainous regions but, it also has a substantial effect on topography by lowering crustal thikness through erosion (Wolf et al., 2022). To comprehende the complex retroaction of mountain ranges and climate over geological time, we must first determine the altitude reached by mountain ranges and when this occurred. To date, many paleoaltimeter methods have been developed to quantify the rise of mountains. Stable isotope paleoaltimetry is one of the most widely used of them (Poage and Chamberlain, 2001; Rowley and Garzione, 2007). Current measurements of the oxygen or hydrogen isotopes of minerals formed in the rock in the presence of meteoric water flows serve as the base for paleo-altitudes reconstruction methods (Rowley et al., 2001; Mulch and Chamberlain, 2007). It is therefore theoretically possible to reconstruct the altitude of a relief through time based on the consistent lowering of δ18O and δ2H of meteoric water with increasing elevation (Blisniuk and Stern, 2005). This widely used approach is indirect since it requires knowledge of the temperature of mineral formation, the temperature-dependent water-mineral isotope fractionation, and the composition of the moist air mass at sea level or before it begins to condense at higher altitude (Mulch et al., 2004).
The goal of this research is to use the H and O isotopic composition of water in fluid inclusions (FIs) of quartz veins to reconstruct the paleoaltimetry of mountain ranges. The site chosen for this study is the Western Alpine Belt, where a number of studies have demonstrated, for instance, the diachronism of exhumation between the internal and external Alps through the age of sedimentary deposits in alpine peripheral basins and the age of deformation and metamorphism of the massifs (Simon-Labric et al., 2009; Schwartz et al., 2007). The idea is to test our approach on two famous Alpine massifs: the Chenaillet massif (internal Alps) and the Mont Blanc massif (external Alps). The selection of these massifs is based on the various petrological and geochronological studies that have been caried out on it. According to these results, the Mont Blanc massif was exhumed between 22 and 13 Ma (Leloup et al., 2005; Rolland et al., 2008). More over, a large number synkinematic quartz veins that intersect the massif have been dated. K–Ar dating on adularia (hydrothermal K-feldspar) and Th-Pb on monazite from these veins yields ages in the range of 15.2– 18.3 Ma and 19-5 Ma, respectively (Leutwein et al., 1970; Rossi and Rolland, 2014; Bergemann et al., 2019). The Chenaillet Massif is a witness of the Tethyan oceanic lithosphere (Lagabrielle et al., 1987). There is no datation on quartz veins on the Chenaillet Massif, however, low-temperature thermochronological data (apatites fission traces, Schwartz and 2007) and the lithological content of conglomeratic sequences filling the Oligocene Alpine foreland basins (Morag et al., 2008; Jourdan et al., 2012, Grosjean et al., 2016) attest to the outcrop of this massif from approximately 35 MA (Grosjean et al., 2016).
2 Geological setting
The Mont Blanc Massif (MBM) is part of the so-called External Crystalline Massifs (ECM) (Figs. 1A and 1B) corresponding to the European Variscan crust (Bussy and von Raumer, 1993) exhumed by the Alpine tectonics during the Miocene (Leloup et al., 2005; Boutoux et al., 2016). It is composed of Hercynian plutonic rocks dated between 453 ± 3 Ma and 304 ± 3 Ma (Bussy and Von Raumer, 1994). The Massif is limited eastward and westward by ductile reverse faults with inverse mergence accountable for its exhumation (Bertini et al., 1985; Leloup et al., 2005) dated between 47 and 13 Ma (Rolland et al., 2008). In the Massif, tension gashes or veins cemented by quartz, chlorite, adularia and calcite (Poty, 1967; Poty et al., 1974) are dated between 7 and 16 Ma (Leutwein et al.,1970; Rossi and Rolland, 2014; Bergemann et al., 2019).
The Chenaillet Massif (CM) in the western Queyras domain (Figs. 1A and 1C) is a testimony to the Tethysian oceanic lithosphere (Lagabrielle, 1987) that was obducted onto the European continental margin 67.9 ± 8.5 Ma ago (Schwartz, 2000). The lack of high-pressure metamorphism revealed that the CM remained in superficial position since obduction (Schwartz et al., 2007). The occurrence of exotic pebbles (gabbro, basalts, radiolarites) in the conglomeratic sequence that filled Oligocene alpine foreland basins (Grosjean et al., 2016, Jourdan et al., 2012) indicates that the Chenaillet Massif has been exposed and thus eroded for the last 30 million years. According to Morag et al. (2008) and Jourdan et al. (2012), the absence of a considerable volume of sediment in Oligocene sedimentary sequences suggests slow uplift rates. As a result, the Queyras Oligocene topography has stayed essentially constant in altitude for almost 30 million years.
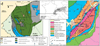 |
Fig. 1 A-Location of the Western Alps, B- Simplified geological map of the Mont Blanc Massif (MBM), C- Simplified geological map of the Chenaillet Massif (CM), 67.9 ±8.5 Ma = fission-track data for zircon from Chenaillet; 22.84 ±1.15 Ma = fission-track age for apatite from the Lago Nero Schistes Lustrés (Schwartz. 2000). Localization of the samples studied: blue diamond = quartz samples, white circle = water samples. A -Localisation des Alpes occidentales, B- carte géologique simplifiée du Massif du Mont Blanc (MBM), C-carte géologique simplifiée du Massif du Cenaillet (CM); 67.9 ±8.5 Ma = âge trace de fission sur zircon du Chenaillet; 22.84 ±1.15 Ma = age trace de fission sur apatite Schistes Lustrés du Lago Nero (Schwartz. 2000). Localisation des échantillons étudiés : losange bleu = veines de quartz, cercle blanc = échantillons d'eau. |
3 Material
3.1 Meteoric waters
In this study « meteoric waters » refer to all the meteorically derived waters (rainfall, snow, and lake water). The meteoric waters were collected in 2009 during a field campaign in late summer (end of August) on Mont Blanc Massif and late Fall (May) on the Chenaillet Massif. Prior to examination, the water samples were stored in a freezer in plastic (or polyethylene) bottles. The analyses were completed for no more than a week following the sampling. Some precipitation was collected on the same day and was not subjected to any evaporation or contaminating processes, its original composition was preserved. Other water from lakes or glacier runoff, or snow from enduring glaciers were collected to have acces to winter precipitation and to assess the effects of potential evaporation from precipitation that reached the ground before infiltrating into the fractures of the crust. Following retrieval, all the meteoric waters were placed into fully filled plastic bottles and sealed to prevent evaporation before analysis. These meteoric waters will serve as a reference for the fossil waters contained in quartz’s FIs.
3.2 Quartz samples
3.2.1 Petrography of the quartz vein
We observed three different types of quartz veins in the Mont Blanc Massif: 1) partially cemented veins (Fig. 2A) geodic cavities with automorphic quartz crystals (Fig. 2B): and 3) fully cemented veins composed of xenomorphic quartz, feldspar, chlorite, and calcite (Fig. 2C). Petrographic observations reveal that the partially cemented veins contain undeformed quartz fibers whose development orientation is from the wall to centre of the vein (Fig. 2D). Quartz in fully cemented veins experienced intracrystalline deformation marked by weakly developed undulose extinction, resulting in hardly discernable deformation laminae (Fig. 2E). Locally, the grain’s sinuous contours indicate minor grain boundary migration (Fig. 2F). The veins of the Chenaillet Massif are entirely cemented by quartz fibers with little to no intracrystalline deformation (Figs. 2G and 2H).
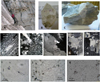 |
Fig. 2 A- field Quartz veins from the MBM (photo Y. Rolland), B- geodic quartz, C-sealed and unsealed quartz veins, D- thin sections of quartz fibers of an unsealed vein, E and F- microstructures in quartz grains of sealed veins of the MBM; G and H sealed quartz veins in basalts and sandstones form the CM; I and J- primary and secondary Fluides Inclusions (FIs) in quartz from the MBM; K- primary FIs in quartz veins from the CM. A- Veine de quartz du MBM, B : quartz géodique, C- veines de quartz cimentées et non cimentées, D - lame mince montrant des fibres de quartz dans une veine non cimentée, E et F -microstructures dans les grains de quartz des veines cimentées du MBM; G et H - veines de quartz cimentées dans les basaltes et les grès du CM; I et J-Inclusions Fluide (IFs) primaires et secondaires dans le quartz du MBM; K- IFs primaires dans les veines de quartz du CM. |
3.2.2 Fluid inclusion typology
Microscopic observation of quartz thin sections allow us to establish the typology of FIs (shape, size, number of phases at room temperature and the fluid/vapour ratio) and to establish the relative chronology between the different generations of FIs. Most of them are biphasic with a gas bubble representing 20–25% of the total volume of the inclusion. Fluid inclusions are classified into three generations: primary fluid inclusions (PFIs) which are generally located in the core of quartz crystals and near the boundaries between two quartz crystals (Fig. 2I), pseudo-secondary (PSFIs) and secondary (SFIs) inclusions which are aligned along planes of healed microfractures embedded in quartz or intersecting several quartz crystals, respectively (Figs. 2J and 2K).
3.3 Dating the veins
Automorphic adularia grains can be found in the open veins of the Mont Blanc Massif, alongside quartz. We carefully removed them with a smal chisel and hammer in order to date them. The Chenaillet’s bedrock, composed of the Queyras Schistes Lustrés, contains veins with similar geometries (orientation, dip) that have been chronologically constrained. We will compare the Chenaillet quartz veins to the Schistes Lustrés veins in order to determine their timing of formation.
4 Method
4.1 Microthermometry measurements of quartz FIs
Double-polished slides 400 microns thick are used for microthermometric analyses. Phase transition temperatures of fluid inclusion assemblies (FIAs ∼ 20 FIs) are obtained by microthermometry. All inclusions in each FIA must share a similar composition (salinity) and density related to the same fluid circulation event (Goldstein and Reynolds, 1994). Microthermometry measurements were carried out at the LGL-TPE (University of Lyon France) using a Linkam MDS600 instrument calibrated with synthetic fluid inclusions (pure CO2 and H2O), the uncertaintiy on the measured temperatures is ± 0.1 °C. The temperatures obtained are as follow: i) the ice melting temperature (Tim), related to the salinity of the fluid is obtained by freezing the FIs to −196 °C with liquid nitrogen, then heating the FI to melt the ice down to the last ice crystal, ii) the homogenisation temperature (Th) obtained by heating the FI until the phases (liquid/vapour/crystal) present are homogenised. The Th is the minimum temperature at which the inclusion formed and determines the temperature required to cause quartz decreptitation on the vacuum line. Zhang and Frantz's (1987) empirical equation of state (EOS), which only required Tim and Th, was used to calculate the isochores.
4.2 Isotopic measurements of meteoric waters
To analyze meteoric samples taken from the Mont Blanc and Chenaillet mountains, aliquots of 200 μl of water were equilibrated at 313 K with CO2 (in the presence of a Pt catalyst) and analyzed using a MultiPrepTM system online with a GVI IsoPrimeTM dual-inlet isotope ratio mass spectrometer at the LGL-TPE in Lyon. The reproducibility of δ2H and δ18O values was estimated to be ± 1‰ and ± 0.1‰ respectively, by measuring the same sample at least twice. Raw data was normalized to the isotopic ratios of VSMOW, SLAP and GISP international reference materials measured with the samples.
4.3 Extraction and Isotopic measurements of water FIs
Extraction by thermal decrepitation: Quartz samples were ground into 1 mm grains, handpicked under a binocular, washed with nitric acid diluted 3 times, rinsed with distillated water and then dried in an oven at 100 °C for 48 hrs. Four grams of quartz are placed in a quartz tube connected to the vacuum line. The sample is then heated to 80 °C for 20 min to remove moisture adsorbed on the surface of the grains. Throughout this procedure, the line pump is open, after which pumping stops and the sample is heated to 450 °C for 15 min. The fluids (CO2 + H2O) were collected in a liquid nitrogen trap for 30 min and cryogenically separated using a mixture of liquid N2 and ethanol at about −80 °C for 10 min to retain only the water contained in the FIs. Finally, two methods were used to analyze the isotopic composition of the water.
-The conventional technique used to analyze the FIs samples involves analyzing the water’s O and H separately. To obtain the δ18O of the water released by the FIs we adopt a micro-equilibration method between CO2 and H2O (Kishima and Sakai, 1980; Lécuyer et al., 1994). Water gets mixed with CO2, whose quantity and δ18O value are known. After 24 h of equilibration at 30 °C, the oxygen isotope composition of CO2 is measured again and, the δ18O value of water is calculated using a mass balance equation (Kishima and Sakai, 1980). The uncertainties associated with this measurement can reach more than 1 ‰ when the amount of water is too small compared to the CO2 used for equilibration. The amount of water is determined by comparison with a series of water samples of known weights ranging from 0.5 to 3.5 μL. After expansion of H2 into a constant volume of the mass spectrometer sample inlet, the amount of gas is estimated from the voltage of mass 2 collector, the uncertainty associated with this method is ∼ ±0.05 μL. Following equilibration, the same water is collected into a glass silica tube that holds roughly 500 mg of finely ground chromium metal. After 5 min reduction of this water by Cr at 1000° C, H2 gas is produced, and the D/H ratio is measured using a dual-inlet GV PrismTS mass spectrometer. By normalizing raw data to the VSMOW-SLAP scale, the external repeatability of D/H measurements was assessed to be ±3‰. Each batch of water samples collected from the fluid inclusions is analyzed along with aliquots of SLAP, GISP, or VSMOW.
-The second technique developed in study consists of simultaneous analysis of the water ‘s O and H isotope composition. A transparent Teflon sample holder (cxTeflon® PFA) is used to trap the little amount of water (2 to 10 μL) released during decrepitation. The Teflon sample holder was chosen due to hydrophobic properties, which allow water to slide down the tube wall and concentrate at the base. Then the water is siphoned with a Hamilton® glass syringe and transferred to a hydrophobic vial. Each hydrophobic vial is centrifuged immediately after extraction to recover all of the sample and avoid analytical biases such as isotopic fractionation in the vial. The Off-Axis Integrated Cavity Output Spectrometer (OA-ICOS) IWA-45EP (Los Gatos Research, Mountain View, California), is used to measure simultaneously the H and O isotope ratios by repeatedly injecting 1 μL of water into the laser spectrometer. Tests were conducted on reference water samples with established δ2H and δ18O compositions to ensure the laser-coupled spectrometer's calibration is suitable for measuring small (1μL) water samples. Two water samples with known δ2H and δ18O values were used: one from the Alps with a δ2H of −104 ‰ and δ18O of −14.8 ‰, and one from Greenland with a δ2H of −202 ‰ and δ18O of −26.3 ‰. After two sets of six measurements the averages of the last four measurements (the first two were caused by the memory effect of the previous sample) yielded findings for δ2H and δ18O of −108.0‰ and −14‰ for the first set, and −106.0‰ and −14.4‰ for the second. Greenland water samples had δ2H and δ18O values of −204.1‰ and −26.1‰, and −203.9‰ and −26.7‰, respectively (Tab. 1).
Standard waters were also used to assess the FIs water samples. These chosen standards have composition comparable to that of the fluid inclusions acquired by the traditional approach. Standard water measured every seven analyses of a natural sample is used to rinse the syringe utilized to inject the sample into the spectrometer, preventing the memory effect of a previous sample. The δ2H and δ18O values are reported to Los Gatos Research’s « 4C » standard water sample (δ18O = −7.94 ‰ VSMOW2; δ2H = −51.6 ‰ VSMOW2). The analyzer's maximum uncertainty is ±5.5 ‰ for hydrogen and ±0.4 ‰ for oxygen. Given that we do not inject as many replicas for our samples, we can instead estimate the analyzer’s uncertainty at ±8 ‰ for hydrogen and ±1 ‰ for oxygen.
Extraction by crushing under vaccum: Quartz samples were ground into 1 mm grains, handpicked under a binocular, washed with nitric acid diluted 3 times, rinsed with distillated water.
Grains weighing from 10 to 15 g and measuring several millimeters were loaded into steel tubes and degassed overnight at 120 °C under vacuum in order to release any water adsorbed at the mineral surface. H2O was reduced into H2 through an uranium reactor at 800 °C. The H2 was measured in dual inlet on MAT 253 spectrometer of the PLASSTAN plateforme at the CRPG (Vandoeuvre-lès-Nancy, France). External reproducibility is ± 2‰ for H2.
Results of δ2H and δ18O measurements expected and obtained for standard water samples from Cervières and Greenland. Values in red are the averages of the last four measurements. All values are expressed in.
Résultats des mesures des δ2H et le δ18O attendus et obtenus pour les échantillons d’eau standards de Cervières et du Groenland. Les valeurs en rouge sont les moyennes des quatre dernières mesures.
4.4 40Ar/39Ar dating of MBM veins
Adularia crystals were found in an unsealed horizontal vein (9MB 64) collected at 653 m altitude and a fully sealed vertical vein (9MB11) collected at 2200 m altitude, both of which had isotopic composition of quartz fluid inclusions analysed in this study. Adularia cristals were irradiated in the University of Michigan’s Phoenix Memorial Laboratory reactor. Irradiation interference on K, Ca and Cl was corrected by irradiating and analyzing pure KCl and CaF2 salts. J factors were determined using duplicates of the Fish Canyon sanidine standard with an age of 28.02 Ma (Renne et al., 1998). The samples were analyzed in Montpellier, after being loaded into an aluminum packet and step heated in a double vacuum Staudacher-type furnace; the temperature was measured using a thermocouple. The gas was purified using cold traps with liquid air and Al-Zr getters. Once cleaned, the gas was introduced into a VG3600 mass spectrometer and allowed to equilibrate for 2 min before being analyzed statically. For 40Ar and 39Ar, signals were measured using a Faraday cup with a 1011-ohm resistor, while 39Ar, 38Ar, 37Ar, and 36Ar were analyzed with a photomultiplier after interaction on a Daly plate (Arnaud et al., 2003).
Since plateau ages for K-feldspars cannot be defined, we used simple mean ages (unweighted) to compare and discuss series of steps with similar ages. An inverse isochron diagram of 36Ar/40Ar versus 39Ar /40Ar was used to determine isochron ages (Roddick, 1978; Roddick et al., 1980). This representation commonly identifies homogeneous excess components. Individual errors on each point and linear regression using York’s (1969) method are examples of errors on age and intercept age. Mean square weighted deviation (MSWD) is measured of goodness of fit in relation to individual mistakes.
5 Results
5.1 Microthermometric data
The Mont Blanc Massif samples: We performed microthermometry measurements of 400 inclusions from height Mt Blanc quartz samples (Tab. 2). Three of the eight quartz samples come from geodic veins (9MB1a, 9MB17, 9MB30) which were collected at elevations of 2535 m, 1660 m and 1550 m. One sample is from an unsealed vein (9MB37) taken at 2260 m. The other four samples are from sealed veins (9MB43, 9MB44, 9MB48, 9MB56) collected at elevations of 3755 m, 2505 m and 2319 m respectively. Geodic quartz FIs (samples 9MB1a, 9MB17, 9MB30) exhibit ice melting temperatures (Tim) ranging from −1.4 °C to −29.9 °C, corresponding to salinities of 2.4 to 28.6 wt% eq NaCl, and homogenisation temperature ranging from 125 to 399 °C. The Tim of the quartz’s sealed veins FIs (samples 9MB43, 9MB44, 9MB48, 9MB56) ranges between −3.2 °C and −18.7 °C, corresponding to salinities of 5.7 to 19.7 wt% eq NaCl, the homogenisation temperature for these veins’ ranges between 120 and 388 °C. Finally, the Tim of the the FIs of the unsealed vein’s quartz (sample 9MB37) ranges from −3.8 °C to −14.9 °C, corresponding to salinities of 6.2 to 18.6 wt% eq NaCl, and their homogenisation temperature ranges from 186 °C to 410 °C.
The Chenaillet Massif samples: Schwartz (2000) examined the low-grade metamorphic structures in the Queyras schistes Lustrés unit and identified two vein geometries: symmetrical interboudin veins perpendicular to the foliation and “echelon” veins. These features are understood as a continuum of deformation controlled by the Queyras' vertical shortening and westward tilting in connection to its exhumation. More than 500 FIs from the Schistes Lustrés quartz veins were measured microthermometrically, and the results display ice melting temperatures (Tim) between −0.1 °C and −6 °C, which correspond to salinities from 0.2 to 10 weight% eq NaCl, and homogenization temperatures ranging from 104 °C to 347 °C (Tab. 2). The filling (quartz, chlorite, adularia) and structural features (orientation/dip) of the veins in the Chenaillet Massif are exactly the same as those described by Schwartz (2000). Given this, we have used the microthermometric data on the quartz veins from the Queyras Schistes Lustrés to estimate the temperature-pressure conditions for the Chenaillet veins formation..
Micrthermometric data obtained on quartz veins from the CM (Schwartz, 2000) and MBM (this study) together with the type of quartz veins and the altitude of sampling. Tm ice = ice melting temperature, Th = homogenization temperature, L = liquid, V = vapor;%wt NaCl = sality of the fluid.
Données microthermométriques obtenues sur les veines de quartz du CM (Schwartz, 2000) et du MBM (cette étude) avec le type de veines de quartz et l'altitude d'échantillonnage. Tm ice = température de fusion de la glace, Th = température d'homogénéisation, L = liquide, V = vapeur;%wt NaCl = salinité du fluide.
5.2 Depth of Quartz vein formation
The homogenization temperature (Th) and the Ice melting temerature (Tim) values obtained from the micro-thermometry study were used to calculate the isochores of the fluid inclusions (Zhang and Frantz, 1987; Bodnar 1993). The pressure and temperature of formation of a FI are determined by the coordinates of the point where the isochore intersects with the thermobaric gradient or a thermobarometer. The thermobaric gradient is calculated from the geothermal gradient at the time of the geological process and a hydrostatic or lithostatic gradient depending on whether the fluid circulating in the rocks is in relation to the surface or not. In the MBM, we employed the thermobaric gradient defined by Leloup et al. (2005) coupled with a lithostatic gradient to determine the pressure and temperature conditions for the FIs entrapment. According to Leloup et al.'s thermobaric gradient, these pressure-temperature conditions correlate to formation depths ranging from 2 to 7.2 km (Tab. 3). Schwartz (2000) used the thermometer based on the Al(IV) of chlorites (Cathelineau, 1988) intersecting the isochores to determine the formation conditions of the FIs in the quartz veins of the Quyeras Schists. Veins formation conditions in the Mont Blanc Massif range from 0.6 to 2.15 kb and temperatures of 178 °C to corresponding to a formation depth of 2 to 7.2 km (Tab. 3). The inter-boudin early veins in the Queyras Unit formed at pressure-temperature conditions of 2.5 to 5.1 kb and 290 to 325 °C, which corresponds to a formation depth of 9.5 to 18 km (Tab. 3). The “en echelon” late veins, formed between 340 and 380 °C and between 0.5 and 2.1 kb, corresponding to a depth of 2 to 8 km (Tab. 3).
Pressure – temperature conditions of entrapment of the FIs of quartz veins from the MBM (this study) and the CM (Schwartz, 2000).
Conditions de pression - température de piégeage des IFs des veines de quartz du MBM (cette étude) et du CM (Schwartz, 2000).
5.3 Isotopic composition of meteoric water
All isotopic compositions of meteoric water, including rainfall, glacier melt water and water from puddles collected in August on the MBM and May in the CM are reported in Table 4.
On the MBM, meteoric waters sampled at high altitudes show more negative values than at lower altitudes (Tab. 4A). As an illustration, sample EM06, a snow glacier taken at 3759 m has δ2H value of −144.3 ‰ and a δ18O value of −18 ‰, while a rain sample EMB3 collected at 1200 m, has δ2H value of −33 ‰ and a δ18O value of −4.9 ‰. This trend does not apply to sample EMB05 (δ2H = −101.1 ‰; δ18O = −12.9 ‰), a summer snowfall taken in August at 3804 m, with values comparable to those of samples EMB4 and EMB2, which were taken at 2300 m i.e 1500 m below. The fact that samples EMB1, EMB2, EMB4, and EM06 are either winter snow or runoff from perennial glaciers—that is, remains of winter precipitation—explains their noticeably negative isotope readings. We have also reported the average seasonal precipitation compositions for the current year (waterisotopes.org) at the elevations where we collected precipitations during our field trips (Tab. 4C). During the summer, the average monthly precipitation is from −40.85 ‰ to −71.85 ‰ and from −6.24 ‰ to −10.68 ‰ for the δ2H and the δ18O respectively. During the winter the average monthly precipitation range from −88.2 ‰ to −130.2 ‰ for the δ2H, and from −11.28 ‰ to −17.94 ‰ for δ18O (Tab. 4C). We report their isotopic composition in a δ2H versus δ18O diagram (Fig. 3A), along with the global meteoric water line (GWML) and meteoric samples collected during our field trip. Sample EMB05 (δ2H = −71.85 ‰; δ18O = −10.68 ‰) from August snowfall at 3800 m altitude has a somewhat lower composition than the typical summer precipitation at the same altitude (Tab. 4A, Fig. 3A). Samples EMB1, EMB2, and EM06 represent glacier snow or water and have composition like normal winter precipitation at comparable heights (Tab. 4C, Fig. 3A). Overall, the isotopes compositions of water and snow samples collected on the MBM correspond to the isotopic compositions of winter and summer precipitation during a year at the stated elevations.
Table 4B summarizes the isotopic composition of the meteoric waters collected on the Chenaillet massif during the field trip in May. The δ2H and δ18O isotope values vary from −83 ‰ to −108.1 ‰ and from −11.8 ‰ to −15.9 ‰ for the δ18O respectively. During the winter the mean monthly precipitation (site waterisotopes.org) ranges from −95.6 ‰ to −102.4 ‰, for δ2H and from −13.62 ‰ to −14.44 ‰ for δ18O (See Tab. 4B). During the summer the mean monthly precipitation (site waterisotopes.org) varies from −46.14 ‰ to −52.14 ‰, for δ2H and from −7.14 ‰ to −9.97 ‰ for δ18O (Tab. 4B). The average isotopic composition values for winter and summer precipitation on the CM are less dispersed due to a small altitude range of 2160 to 2650 m. Finally, we find that, despite being more dispersed, our samples closely resemble the composition of winter precipitations when compared to monthly rainfall averages (Fig. 3B).
Average winter and summer isotopic composition of rainfall on the MBM and the CM at elevations comparable to the samples collected during our fieldwork (site waterisotopes.org). Isotopic composition of the meteoric waters collected on the MBM and the CM.
Composition isotopique moyenne des précipitations (site waterisotopes.org), en hiver et en été, sur le MBM et le CM à des altitudes comparables à celles des échantillons prélevés lors de notre campagne de terrain. Composition isotopique des eaux météoriques recueillies sur le MBM et le CM.
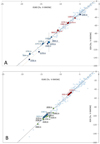 |
Fig. 3 A- δ2H versus δ18O diagrams showing the mean isotopic compositions of winter and summer precipitation at identical altitudes to precipitation sampled in August on the MBM. Blue triangles = winter precipitation compositions, red triangles = summer precipitation compositions (waterisotopes.org website), blue diamond = precipitation sampled in August on the MBM. The average isotopic composition of meteoric waters sampled on the MBM during the filed survey in August is represented by the blue squarre. The data are plotted with the isotopic compositions of modern global precipitation in the Northern Hemisphere (light grey triangle) taken from Rozanski et al. (1993) and the meteoric water line calculated from these data. B–δ2H versus δ18O diagrams showing the mean isotopic compositions of winter and summer precipitation at identical altitudes to precipitation sampled in May on the CM. Blue triangles = winter precipitation compositions, red triangles = summer precipitation compositions (waterisotopes.org website), green dots = precipitation sampled in May on the CM. The average isotopic composition of meteoric waters sampled on the CM during the field survey in May is represented by the green squarre. The data are plotted with the isotopic compositions of modern global precipitation in the Northern Hemisphere (light grey triangle) taken from Rozanski et al. (1993) and the meteoric water line calculated from these data. A- Diagramme δ2H versus δ18O montrant la composition isotopique moyennes des precipitations hivernales et estivales à des altitudes identiques aux precipitations prélevées en Aout sur le MBM (diamant bleu.). Les triangles bleus = compositions des precipitations hivernales, les triangles rouges = precipitations estivales (site waterisotopes.org). La moyenne des compositions isotopiques des eaux météoriques prélevées en Aout sur le MBM est représentée par le carré bleu. Les données sont associées aux compositions isotopiques des précipitations modernes mondiales de l'hémisphère Nord (triangles gris clair) issues de Rozanski et al. (1993) et la droite des eaux météoriques calculée à partir de ces données. B- Diagramme δ2H versus δ18O montrant la composition isotopique moyennes des precipitations hivernales et estivales (site waterisotopes.org) à des altitudes identiques aux precipitations prélevées en mai sur le CM (cercles verts,). La moyenne des compositions isotopiques des eaux météoriques prélevées en mai sur le CM est représentée par le carré vert. Les données sont assoxiées aux compositions isotopiques des précipitations modernes mondiales de l'hémisphère Nord (triangles gris clair) issues de Rozanski et al. (1993) et la droite des eaux météoriques calculée à partir de ces données. |
5.4 Isotopic composition of FIs water
The two techniques for extracting (thermal decrepitation and crushing) and analyzing water FIs (the conventional method and the new one) were applied on both the MBM and the CM samples.
The conventional method used on the 6 CM samples after thermal decrepitation give δ2H values that vary from −83 ‰ to −99.7 ‰ with an average value of −86.7‰. The δ18O values calculated using the meteoric water line equation, range between −11.6 ‰ to −12‰ (Tab. 5B). The new technique applied to 5 of the CM veins gives δ2H values varying between −79.4 ‰ and −120.3 ‰ with an average value of −105.6 ‰. The δ18O values range from −6.4 ‰ and −16.9 ‰ with anverage value of −15.8 ‰. We used the crushing approach to obtaine the δ2H of two samples from the CM since the deuterium varies between the two techniques. Compare to the values obtained after decrepitation, the “Rocher Perdrix” sample yielded a value of −79.5 ‰, close to the value obtained with the traditional approach (−83 ‰) and identical to the value obtained with the novel method (−79.4 ‰). The “Rocher Aigle” sample yielded a value of −81.5 ‰ close to value obtain with the classical approach (−84.3 ‰) but less negative than the value of −102.7‰ obyaind by the novel method (Tab. 5B).
The isotopic compositions of FIs plotted on a δ2H versus δ18O diagram (Fig. 4B), show that all the values fall to the meteoric water line. Only one sample plot below and away from the GMWL this sample is less negative than the other samples. Therefore, there is convergence in the results obtained with the differents methods as the isotopic values of the water contained in the FIs of the Chenaillet quartz veins reveal a superficial (meteoric) source.
All the samples from the MBM underwent thermal decrepitation extraction; two horizontal veins (9MB64 and MB03-51) and one crumbled block (MB03-24) were examined using the conventional method, while the remaining samples were examined using the new method developed in this study. Both techniques are applied to a single sample (9MB64). Five samples have been subjected to crushing extraction: one syntectonic vein (9MB52), two horizontal veins (9MB44 and 47), and two vertical veins (9MB11 and 28).
The results obtained using the new method after thermal decrepitation are summarized in Table 5A. The isotopic composition of fluid inclusions in horizontal veins have δ2H values between −68.8 ‰ and −38‰ and δ¹O values between −9.1‰ and −5‰. Two vertical veins yielded δ2H and δ18O values of −76.8 ‰ and −38.4 ‰ and −10.55 ‰ and −5.9‰, respectively. For the three syntectonic veins this method produced δ2H values ranging from −59.4 ‰ to −34.1‰ and δ18O ranging from −7.26 ‰ to 4.2 ‰ (Tab. 5A). Three veins were analzed using the traditional method, the two horizontal veins (MB03-51, 9MB64), gave δ18O values of −9.5‰ and −5.8 ‰ and δ2H values of −42.4‰ and −33.2‰. The crumbled block (sample MB03-24), whose veins cut across the foliation of the host rock, has δ2H and δ18O values of −42.4‰ and −5.8‰, respectively.
The results obtained after crushing are presented in Table 5A. The two horizontal veins (9MB 44 and 47) analyzed with the conventional method give δ2H values of −51.8 ‰ and −41.1 ‰ respectively, as opposed to −45 ‰ and −68.8 ‰ obtained with the new method (Tab. 5A). The two vertical veins (9MB 11 and 28) produced δ2H values of −52.3 ‰ and −42.3 ‰, respectively, while the new approach produced values of −38.4 ‰ and −76.8 ‰. Ultimately, the synkinematic vein (9MB52) yielded a δ2H value of −63.8 ‰, whereas the new approach yielded a value of −34.1 ‰.
When the isotopic compositions of FIs are plotted on a δ2H versus δ18O diagram (Fig. 4A), most of the values fall to the meteoric water Line. The composition of the FIs of the horizontal and vertical veins suggests that these fluids originate from a meteoric source. On the other hand, the compositions of the three syntectonic veins diverge from the meteoric water line, with oxygen values that are very slightly negative or even positive. These compositions imply varying degrees of contamination by a deeply rooted fluid, most likely of metamorphic origin.
A- Isotopic composition of aqueous fluids extracted from the fluid inclusions quartz veins from the MBM. Two methods (thermal decrepitation and crushing) have been used to extract the fluids from horizontal, vertical and syntectonic veins and two methods (conventional and the new method developed in this study) have been uses to analyse the fluid inclusions. B - Isotopic composition of aqueous fluids extracted from the fluid inclusions quartz veins from the CM. Two methods (thermal decrepitation and crushing) have been used to extract the fluids from the vertical veins and two methods (conventional and the new method developed in this study) have been uses to analyse the fluid inclusions.
A- Composition isotopique des fluides aqueux extraits des inclusions fluides des fentes de quartz du MBM. Les deux méthodes (décrépitation thermique et crushing) ont été utlisé pour extraire les fluides des veines horizontales, verticales et syntectoniques et deux méthodes d’analyses (conventionnelle et nouvelle méthode développée dans cette étude) ont été utilisées pour analyser les inclusions fluides. B - Composition isotopique des fluides aqueux extraits par décrépitation thermique et crushing des inclusions fluides des fentes de quartz du CM et analysée par la méthode conventionnelle et la nouvelle méthode développée dans cette étude.
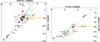 |
Fig. 4 A- Plot of the δ18O vs δ2H values of the FIs from the MBM, grey dots = vertical veins, red dots = horizontal veins, orange dots = syntectonic veins. The average values of the FIs for each veins family are represented by grey, red and yellow squares respectively. The number near the symbols refer to the altitude of the meteoric water samples and the quartz veins. Blue diamonds = compositions of meteoric waters sampled at the same elevation as the quartz veins. The δ2H values acquired by the traditional approach upon crushing are shown in the yellow area. The data are plotted with the meteoric water line for the Northern Hemisphere (GMWL) and the local metoric water (LMWL). B- Plot of the δ18O vs δ2H values of the FIs from the CM, Vertical veins are shown in green, the average value of the FIs is represented by a green square. The six veins analyzed using the conventional method are shown with purple dots. The 5 veins analyzed using the new method are represented with green dots. The δ2H values acquired by the traditional approach upon crushing are shown in the yellow area. The data are plotted with the meteoric water line for the Northern Hemisphere. A-Valeurs du δ18O et du δ2H des IFs du MBM. Les veines verticales sont représentées en gris, les veines horizontales en rouge et les veines syntectoniques en orange. Les valeurs moyennes de la composition des IFs pour chaque famille de veines sont représentées par des carrés gris, rouges et jaunes respectivement. Les données sont repontées avec la droite des eaux météoriques pour l’hémisphère Nord (GMWL) et la droite des eaux météoriques locales (LMWL), les nombres à coté des symboles indiquen l’altitude de prélèvements des eaux météoriques ou des veines de quartz La zone jaune représente les valeurs du δ2H obtenues par la méthode conventionnelle apres écrasement. B- Valeurs δ18O vs δ2H des IFs du CM, les veines verticales sont représentées en vert, la valeur moyenne des IFs est représentée par un carré vert. Les six veines analysées avec la méthode conventionelle sont représentées en violet. Les données sont reportées avec la droite des eaux météoriquex pour l'hémisphère Nord. La zone jaune représente les valeurs du δ2H obtenues par la méthode conventionnelle apres écrasement. |
5.5 Comparison between the two extraction and analysis methods
The results demonstrate a meteoric origin for the water in nearly all samples, regardless of the method used to extract water from fluid inclusions, the method used to analyze this water, and the laboratory where the analyses were carried out. However, the effectiveness of our novel method, whose accuracy is correlated with the amount of material pumped into the laser, was called into doubt when the D values produced by the new and the classical method on the CM revealed discrepancies of 20‰. Nevertheless, three of the five Mont Blanc samples (9MB11, 47, and 52) whose FIs were extracted by crushing and analyzed wih the conventional method had more negative values (from 7 to 30 ‰) and the other two samples (9MB28 and 44) had values that were 30% less negative when compared to the values obtained using the new method. The two Chenaillet samples analyzed using the traditional approach produced either the same value or a value that is ∼20‰ less negative compared to the new method. Therefore, since there is no discernible trend between the two analysis methods, we interpret the disparities in values obtained as representing the natural variability of meteoric precipitations trapped in quartz during their formation, which can extend over several thousands of years.
5.6 The 40Ar-39Ar data of the MBM Quartz Veins
We used the Ar/Ar technique to date two veins (9MB11 and 9MB64) in Mont Blanc Massif that contains hydrothermal adularia associated with quartz (Fig. 5). The shapes of 9MB11 age spectra (Fig. 5A) show a first low-temperature (LT) pseudoplateau between 10% and 50% of gas release corresponding to a furnace temperature below 1200 °C, followed by an age increase toward a high temperature (HT) plateau or pseudoplateau. The youngest steps on K-feldspar LT ages, or pseudoplateaus defined on K-feldspar LT steps gives an age at ∼ 17Ma (5 consecutive steps, 45.4% of the released 39Ar), the HT pseudoplateau age in a range of 32 to 24 Ma. Isochron diagrams on the LT steps give ages at 14.1±1.3 Ma (MSWD=5).
The shape of 9MB64 age spectra (Fig. 5B) a first low-temperature (LT) pseudoplateau between 10% and 45% of gas release corresponding to a furnace temperature below 1200 °C, followed by a rapid age increase toward a high temperature (HT) plateau or pseudoplateau. The youngest steps on K-feldspar LT ages, or pseudoplateaus defined on K-feldspar LT steps gives an age at 11.7 +/− 1.6Ma (5 consecutive steps, 34.4% of the released 39Ar), the HT pseudoplateau age in a range of 25 to 22 Ma. Isochron diagrams on the LT steps give ages at 11.02 +/− 2.6 Ma (MSWD=10.9)
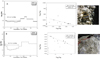 |
Fig. 5 Left - 40Ar/39Ar results for K-feldspar from two MBM veins (9MB11 and 9MB64) sampled at 2200 and 653 m respectively. Double arrows represent age plateaus or pseudoplateaus (see text for explanation on the calculation and use of these terms). Center - Inverse isochrones for which each step is plotted, the regression line corresponds to the calculated age. Step numbers in empty circles were not used for calculations Right - field pictures of the dated adularia. A gauche - Résultats 40Ar/39Ar pour des feldspaths potassiques de deux veines du MBM (9MB11 et 9MB64) échantillonnées respectivement à 2200 et 653 m. Les doubles flèches représentent des plateaux ou pseudoplateaux d'âge (voir l'explication du calcul et de l'utilisation de ces termes dans le texte). Droite - Isochrones inverses pour lesquelles chaque étape est tracée, la ligne de régression correspond à l'âge calculé. Les numéros d'étape dans les cercles vides n'ont pas été utilisés pour les calculs. Right: field photo of the dated adularia. |
5.7 Age of CM quartz veins
The Chenaillet country rock is composed of the Queyras schistes lustrés unit, which was impacted by Alpine regional tectonism and metamorphism resulting in a regional N-S trending foliation dipping 20 to 30° to the west and carrying a greenschist lineation that trends E-W across. Subvertical to 70° dipping toward the East or West quartz veins oriented N150 to N110 cut the foliation. The veins formed because of vertical shortening during extensional setting, which led to the exhumation of the Queyras unit. The final exhumation of the Schiste Lustrés was dated using apatite fission track (AFT), which dates from 9.4 Ma and 22.6 Ma from East to West (Schwartz et al., 2007). The Chenaillet Massif is located in the western Queyras, near the Lago Nero site, which lies structurally beneath the Chenaillet. The quartz veins at this location are oriented N110, comparable to the N100 oriented quartz veins in the Chenaillet. Apatite fission track dating in the Lago Nero yields an age of 22.6 Ma (Fig. 1B) as a result, we assume that the veins at the Chenaillet and Lago Nero are originated simultaneously, some 22 Ma ago.
6 Discussion
6.1 Effectiveness of the method for paleo-elevation reconstruction
In this study, we aimed to show that the paleoelevations of mountain ranges might be reconstructed using the isotopic composition of meteoric water microdroplets trapped as fluid inclusions in quartz crystals. We used two methods; thermal decrepitation and crushing to extract the water from the fluid inclusions. The crushing approach is unable to distinguish between the several generations of fluid inclusions found in minerals. The decrepitation approach, on the other hand, achieves this by heating the sample to various temperatures. We have demonstrated that if the trapping temperatures of different generations of FIs differ by more than 150 °C, they can be extracted and analyzed individually (Gardien et al., 2016). On the other hand, the high temperature decrepitation method has raised concerns about the possibility of oxygene exhange between quartz and water FIs, which is unlikely to occur during crushing at low temperature (120 °C). We will explore this aspect, in relation to Rossi and Rolland’s (2014) study on quartz veins in the MBM. These authors analyzed horizontal veins identical in any respect to the veins we analyzed in this study. The δ18O value of water in equilibrium with quartz was determined using the isotopic fractionation factor of Zeng (1993) equation at temperature ranging between 300 and 450 °C, estimated using the quartz/chlorite thermometer of Wenner and Taylor (1971). The obtained values are within the range of metamorphic water (Fig. 6). Rossi and Rolland (2014) conclude that vein development involves a locally H2O-rich metamorphic fluid in a somewhat closed system. According to our findings, the values of the FIs of quartz veins that emerge from the shear zones at the foot of Mont Blanc shift from the field of meteoric waters to the field of metamorphic waters. This suggets that a deep fluid of metamorphic origin may account for the formation of these veins at high temperatures below the brittle/ductile limit. In that case only the syntectonic vein from a shear zone (orange dots in Fig. 6) may contained a metamorphic fluid showing isotpic equilibrium with the O of the host quartz. In contrast, FIs from vertical or horizontal quartz veins countain fluids that are far separated from the field of metamorphic fluid but plot in the meteoric water domain. Based on these findings, we can argue that the host quartz and the water in the inclusions did not exhange oxygen during our experiments, even though decrepitation occurred at a relatively high temperature. Finally, when comparing the δ18O value of water's FIs to the δ18O value of a fluid in isotopic equilibrium with quartz, we question if the fluid and quartz are genuinely in isotopic equilibrium, as recent research has shown that isotopic equilibrium can at times be difficult to achieve (Bouat et al., 2026). Thus, it is debatable whether calculating the δ18O of a fluid percolating through a rock and creating hydrothermal mineral formation using the δ18O of the quartz is appropriate. This is a legitimate question since isotopic disequilibrium has been observed in several hydrothermal quartz. Recent research (Rottier et al., 2021; Allan and Yardley, 2007) reveals that the δ18O value of a single 1mm-long quartz crystal can vary up to 11 ‰. They explain that this fluctuation can be caused by the variation of physical parameters (temperature, pressure), chemical paramaters (fO2), or mixing of two fluids (deep versus surface) in variable proportions. This can also be explained by the fast growth rate of quartz, which, according to experimental study, ranges from 1 to 0.4 mm/day at 350 °C and pressures ranging from 700 to 1500 bar (Clavier, 2016). These experimental circumstances are like those that occur naturally for the formation of quartz veins.
In this investigation, we analyzed the isotopic composition of the FIs using two different approaches. Kishima and Sakai developed the first approach, known as the conventional one, in 1980, and Lecuyer et al. enhanced it in 1994. The second method developed in this work, analyze the H and O isotopes in a single step using the laser of the IWA-45EP (OA-ICOS). Since it enables the simultaneous analysis of the H and O composition of H2O in quartz's FIs without converting into D and CO2 gases, our approach seems to be an improvement over the traditional one. However, if we currently utilize a powerful heat extraction approach with an extraction line producing satisfactory results, this method entails transferring the water sample to separate sample holders, which may result in sample loss or fractionation due to condensation on the glass tube walls. A prototype coupling between a Solid Sample Module (SSM) and an Off Axis Integrated Output Spectroscopy (OA-ICOS) laser is being designed to replace the present extraction process. The SSM was chosen because it offers several advantages, including a quick and easy pod insertion system, a horizontal combustion tube, a degassing zone, and a direct interface between the furnace and laser. This online approach decreases the possibility of sample loss or contamination, as well as the time required for experiments.
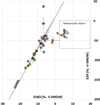 |
Fig. 6 Plot of the δ18O vs δD values of the FIs from the MBM and the CM. The veins from the MBM are represented by grey dots (horizontal veins), red dots (vertical veins) and yellow dots (syntectonic veins). The average values for each vein family are represented by squares of the same color. The grey squares plotting in the metmaoprphic water field are the data of Rossi and Rolland (2014) that calculated the isotopic composition of the fluid that generated MBM quartz, based on the δ18O value of quartz at 300 °C (light grey) and 450 °C (dark grey). The CM veins are represented by green dots. All the data are plotted with the isotopic compositions of modern global precipitation in the Northern Hemisphere (light grey diamond) from Rozanski et al. (1993) and the meteoric water line calculated from these data. Représentation graphique des valeurs δ18O vs δD des IFs des veines du MBM et du CM. Les veines du MBM sont représentées par des ronds gris (veines horizontales), des ronds rouges (veines verticales) et des ronds jaunes (veines syntectoniques). Les valeurs moyennes pour chaque famille de veines sont représentées par des carrés de la même couleur. Les carrés gris qui plottent dans le champ des eaux métamorphiques sont les données de Rossi et Rolland (2014) qui ont calculé la compositin isotopique du fluide à l’orignine de la formation des quartz à partir du 18O du quartz à 300 °C (gris clair) et 450 °C (gris foncé). Les veines du CM sont représentées par des ronds verts. Les données sont représentées avec les compositions isotopiques des précipitations mondiales modernes dans l'hémisphère Nord (diamant gris clair) de Rozanski et al. (1993) et la ligne des eaux météoriques calculée à partir de ces données. |
6.2 The origin of the fluids contained in the FIs of the Alpine Massifs
Regardless of the extraction and analysis method we used, the isotopic compositions of many fluid inclusions (a mixture of primary, pseudosecondary and secondary fluids inclusions) in MBM and CM quartz have a meteoric water composition (Fig. 6). It's a fact that meteoric water penetrates the upper continental crust for several kilimeters (Fontes et al., 1979; Lemarchand et al., 2012; Gardien et al., 2016; Dusséaux et al., 2019, Melis et al., 2023). The penetration and circulation of meteoric water in the upper crust is explained by the porosity and cracking of the rocks in the first 10 to 15 kilometers of the continental crust. Fluid movement in the crust is primarily driven by topographic gradients usually the most efficient one, buoyant forces, and compaction. As meteoric water travels through the crust, it may interact with deep (metamorphic) fluids to varying degrees or become contaminated by the host rock, particularly for the O even buffering its composition. Based on the isotopic composition of the FIs, we found that there is little to no metamorphic fluid in the vertical and horizontal veins taken from the MBM and CM. On the contrary, the main fluid responsible for the growth of quartz, which has been preserved in the FIs, has a meteoric isotopic composition. Deep metamorphic fluids are only visible in the veins that are undergoing ductile deformation in the shear zone at the base of Mont Blanc.
6.3 Significance of FIs isotopic data collected from the MBM
Although they all contain meteoric fluid, the isotopic values obtained from the Mont Blanc’s FIs are more distributed than those from the CM. This dispersion is attributable in part to the larger number of samples (18 for the MBM vs. 5 for the CM) collected at elevations ranging from 653 to 3804 m and at sampling sites spread across Mont Blanc, the Aiguilles rouges, and the Martigny region of Switzerland (Fig. 1). The vertical and horizontal amplitude of the sampling zone indicates a larger surface area for meteoric water drainage, resulting in more fluctuation in the isotopic composition of the precipitation found in the fluid inclusions. More significantly, we observe that there is no correlation between the isotopic composition of the MBM's quartz vein FIs and the altitude at which the quartz was sampled (Fig. 4A). In short, the water in the FIs of the MBM's quartz veins is less negative in general than the meteoric water collected on the MBM during our field campaign (Fig. 3A). Overall, the FI's isotopic composition falls between the precipitation compositions sampled during the field campaign at elevations ranging from 2000 to 1200 meters. When comparing the isotopic compositions of all the FIs to the seasonal precipitation values on the MBM, we find that they are like the summer average compositions of 600 to 3800 m but less negative than precipitation below 600 m in altitude when compared to winter precipitation (Fig. 4A). As a result, one can argue that the quartz veins are sub-actual and that the fluid inclusions in them were formed by contemporary precipitation. Nevertheless, it is challenging to explain why the development of quartz was only due to the penetration of summer precipitation across the crust. Therefore, it would seem more realistic to say that these quartz veins formed when the MBM area's relief was still at a very low elevation.
Now, the challenge is to associate this elevation with a specific phase of the MBM massif's tectonic evolution. The presence of adularia in two of our samples, 9MB11 and 9MB64, which were taken at 2,200 m and 653 m, respectively, provides an indication. Despite being weakly defined, the ages obtained in this study using the K-Ar method on adularia (Fig. 5) are 11±2.6 Ma for 9MB64 (height 653 m) and 14.1±1.3 Ma for 9MB11 (altitude 2200 m). These ages are consistent with the literature, which places the MBM quartz veins formation between 10 and 18 Ma (Leutwein et al., 1970, Marshall et al., 1998a; Bergemann et al., 2019; Rossi and Rolland, 2014). More specifically, Marshall et al. (1998a) used the K-Ar method on adularia to date at 9.9 ± 1 Ma quartz veins from the Mt Chemin Gold Mine (coordinates: 46.053350 N; 7.081113 E) which is located near the site of 9MB64 (Tab. 5).
The dated samples 9MB61 (14 Ma) and 9MB11 (11 Ma) are horizontal and vertical veins, respectively, Thus, our results are consistent with the geochronological data gathered on quartz veins in the MBM, which shows that horizontal veins are often older than vertical ones (Leutwein et al., 1970; Marshall et al., 1998; Rossi and Rolland 2014; Bergman et al., 2019). Furthermore, our results support the hypothesis that the MBM shear zone started about 12 Ma (Leloup et al. 2005). The two samples were dated using the same method (K-Ar on adularia) and belong to the same litho-structural unit, the MBM shear zone (Fig. 1B). Despite not being precisely placed on the same transect, we may estimate an uplift rate of about 0.5 mm/yr based on the time (3 Ma) and altitude (1547 m) differences between the two samples. This rate is in line with the 0.8 mm/yr suggested by Leloup et al. (2005) between 12 and 6 Ma.
Thus, asuming that the veins examined in this study formed during the Middle Miocene, we will attempt to determine the relief elevation in the MBM area at that time. It is possible to circumvent the need for data on the palaeoclimatic conditions of this period and region by using atmospheric thermodynamic modeling of Rowley et al. (2001), which establishes a relationship between altitude and Δδ18O (the difference between the value of 18O at sea level and at a greater altitude) for any given initial climatic state. During the Middle Miocene, sedimentary basins opened up surrounding the Alps’ rising relief, such as the Swiss Molassic Basin to the north of the MBM area. The abundant formation of pedogenic carbonate during the Middle Miocene in the Swiss Molassic Basin therefore allows the reconstruction of a near-sea-level at different periods.
The paleo elevation of the two massifs will be determined using the mean δ18O value of the FIs. We shall not use the standard deviations because the altitude ranges rise enormously (and it is not usual). Consequently, the mean δ18O value for the MBM is −6.93‰ (without the synkinematic veins as their isotopic composition deviates from the meteoric water line), and the average δ18O value for the Chenaillet Massif is −13.7‰. We need to know the δ18O of precipitation at low altitudes in order to calculate the terrain's elevation. The values found in the Swiss Molasse Basin, which surrounds the alpine relief, will be used for this. The value of −5.8% +/− 1.2% for the Middle Miocene epoch determined by Krusnik et al. (2021) will be applied to the Mont Blanc Massif. Since there isn't data near the Chenaillet Massif we also use the Swiss Molasse Basin value of −11% to −8% (average value at 16 °C) obtained by Campani et al. (2012) for the Early Miocene epoch. Combining these numbers gave us an elevation for the MBM between 0 and 1156 meters and for the CM between 2250 and 3750 meters. This illustrates how the relative local elevation was already high in the interior during the early Miocene, while it was extremely low in the external alps.
6.4 Significance of FIs isotopic data collected from the CM
The six Chenaillet samples were analyzed using both the conventional and the new approach established in this investigation. Only the hydrogen isotopic composition of water’s fluid inclusion was measured using the conventional method, the oxygen on the other hand was calculated using the meteoric water line. Unsurprisingly the values plot near the meteoric water line. The same samples were analyzed with the new method. The results reveal a wider range of values for both H and O isotopes but remain within the meteoric water range. On the other hand, the FIs values are remarkably like the isotopic composition of the meteoric waters sampled during the field campaign, as well as the composition of annual winter precipitation at the same heights.
One interpretation is to assess that the quartz veins are recent and contain modern rainfall in their FIs. On the other hand, it's hard to claim that winter precipitation alone created hydrothermal quartz in the CM. Consequently, we propose that the quartz veins formed 22 million years ago. The obduction of the CM onto the European margin occurred 60 million years ago and remained in a superficial position afterward, as demonstrated by the lack of alpine metmorphism (Schwartz et al., 2007). According to apatite fission tracks data, the western part of the Queyras unit was exhumed 25 million years ago, coinciding with the creation of reliefs cut by rivers transporting basalt, radiolarite and serpentinite pebbles from the CM, and deposited as conglomerate in peralpine basins (Schwartz et al., 2007; Jourdan et al., 2012; Grosjean et al., 2016). This pattern is confirmed by palynological study (Fauquette et al 2015), which shows that the southern part of the Western Alps, including the Chenaillet region, has been at an altitude of at least 1900 m since the Early Miocene and possibly since the Oligocene. This high topography has been maintained over the past ∼30 Ma, with slow (∼0.3 km/Myr) long-term average exhumation rates (Fauquette et al 2015). The finding aligns with the isotopic compositions of fluid inclusions in the Chenaillet quartz, which reveal significantly negative values, particularly δ18O (= −13.7 ‰. on average) and the altitude by more than 2500 meters calculated for the Early Miocene epoch.
7 Outlook
Microthermometry analyses of fluid inclusion from the MBM and the CM allow to determine the P-T conditions and depth development in the upper crust that range between 2 and 7 km for the MBM and between 2 and 18 km for the CM. The K-Ar ages of hydrothermal adularia in the MBM's quartz veins allow us to date their origin to between 12 and 17 million years ago. According to the literature, quartz tension veins in the CM formed roughly 22 million years ago.
The multi-method approach we conducted on quartz veins and shear zones in the MBM and CM (Western Alps) enabled us to provide vital information regarding the tectonic history of these massifs. Based on the isotopic composition of FIs in the quartz veins we coclude that the MBM region was at a low altitude 12 Ma ago, significantly lower than the altitude of the western Queyras, where the CM is located, which was already at the same altitude as today.
Finally, the innovative method employed in this study allows us to simultaneously examine the H and O stable isotopes in small amounts (3 to 10 mL) of extracted water. When compared to the conventional equilibration and reduction method of oxygen and hydrogen analysis, the results from this method fall within the same range of values. Thus, we believe that this innovative approach could enhance data quality because it eliminates the need for further preparation and reduces the likelihood of analytical artifacts, sample loss, or fractionation throughout the experiment. These aspects established fluid inclusions as first-order proxies for reconstructed relief paleo-elevations.
References
- Allan MM, Yardley WD. 2007. Tracking meteoric infiltration into magmatic-hydrothermal system: a cathodoluminescence, oxygen isotope and trace element study of quartz from Mt. Leyshon, Australia. Chem Geol 240: 343–360. [Google Scholar]
- Arnaud N, Tapponnier P, Roger F, et al. 2003. Evidence for Mesozoic shear along the western Kunlun and Altyn-Tagh fault, northern Tibet (China). J. Geophys Res Solid Earth 108: 2053. [Google Scholar]
- Bergemann CA, Gnos E, Whitehouse MJ. 2019. Insights into the tectonic history of the Western Alps through dating of fissure monazite in Mont Blanc and Aiguilles Rouges Massifs. Tectonophysics 750: 203–212. [Google Scholar]
- Bertini G, Gianelli G, Pandeli E, Puxeddu M. 1985. Distribution of hydrothermal minerals in the Larderello Travale and Mt. Amiata geothermal fields (Italy). Geotherm Res Counc Trans 9: 261–266. [Google Scholar]
- Bussy, F., and J. F. Von Raumer (1993), U-Pb dating of Palaezoic events in the Mont-Blanc crystalline mas-sif, western Alps, Terra Nova Abstr 5: 382. [Google Scholar]
- Busy F, Von Raumer JF. 1994. U-Pb dating of Palaeozoic event in the Mont Blanc crystalline Massif, western Alps. Terra Nova 5: 382–383. [Google Scholar]
- Blisniuk PM, Stern LA. 2005. Stable isotope paleoaltimetry: a critical review, Am J Sci 305: 1033–1074. https://doi.org/10.2475/ajs.305.10.1033. [Google Scholar]
- Bodnar RJ. 1993. Revised equation and table for determining the freezing point depression of H2ONaCl solutions. Geochim Cosmochim Acta 57: 683–684. [Google Scholar]
- Bouat L, Strzerzynski P, Gardien V. 2026. Long-Term Storage of Meteoric Water in the Variscan Basement: Stable Isotope Constraints (δ-δ18O). Terra Nova, 38:116–123 https://doi.org/10.1111/ter.70021 [Google Scholar]
- Boutoux A, Bellahsen N, Nanni U, Pik R, Verlaguet A, Rolland Y, et al. 2016. Thermal and structural evolution of the externam Western Alps: Insights from (U-Th-Sm)/He thermochronology and RSCM thermometry in the Aiguilles Rouges/Mont Blanc massifs. Tectonophysics 683: 109–123. [Google Scholar]
- Campani M, Mulch A, Kempf O, Schlunegger F, Mancktelow N. 2012. Miocene paleotopography of the Central Alps, Earth Planet. Sci. Lett 337–338: 174–185. [Google Scholar]
- Cathelineau M. 1988. Cation site occupancy in chlorites and illites as a function of temperature. Clay Minerals 23: 471–485. [Google Scholar]
- Clavier D. 2016. Croissance hydrothermale de monocristaux isotypes du quartz-α, étude des propriétés physiques et recherche de nouvelles solutions solides avec des oxydes du bloc p (Ge, Sn) et du bloc d (Mn, V, Ti). Thèse de l’université de Montepellier, 258 p. [Google Scholar]
- Decrée S, Boulvais P, Cobert C, Baele J-M, Midende G, Gardien V, et al. 2015. Structurally controlled hydrothermal alteration in the syntectonic Neoproterozoic Upper Ruvubu Alkaline Plutonic Complex (Burundi): Implications for REE and HFSE mobilities. Precambrian Res 269: 281-295. [Google Scholar]
- Dusséaux C, Gébelin A, Boulvais P, Gardien V, Grimes S, Mulch A. 2019. Meteoric fluid‐rock interaction in Variscan shear zones. Terra Nova 31(4): 366-372. [Google Scholar]
- Fauquette S, Bernet M, Suc JP, et al. 2015. Qunatifying the Eocene to Pleistocene topographic evolution of the SouthWestern Alps, France and Italy. Earth Planet Sci Lett 412: 220-234. [Google Scholar]
- Fontes JC, Bortolami GC, Zuppi GM. 1979. Hydrologie isotopique du Massif du Mont Blanc. IAEA-SM-228/22. [Google Scholar]
- Fourel F, Lécuyer C, Jame P, et al. 2020. Simultaneous δ2H and δ18O analyses of water inclusions in halite with off-axis integrated cavity output spectroscopy. J Mass Spectrom 55: 4615. https://doi.org/10.1002/jms.4615. [Google Scholar]
- Gardien V, Rabinowicz M. Vigneresse JL, Dubois M, Boulvais P, Martini R. 2016. Long-lived interaction between hydrothermal and magmatic fluids in the Soultz-sous-Forêts granitic system (Rhine Graben, France). Lithos 246: 110-127. [Google Scholar]
- Goldstein RH, Reynolds TJ. 1994. Systematics of Fluid Inclusions in Diagenetic Minerals SEPM Society for Sedimentary. Geology 31. https://doi.org/10.2110/scn.94.31. [Google Scholar]
- Grosjean AS, Gardien V, Dubois M, et al. 2016. Sediment provenance during Alpine orogeny : fluid inclusions and stable isotopes on quartz–calcite veins from detritic pebbles. Swiss J Geosci 109: 329–344. https://doi.org/10.1007/s00015-016-0228-1. [Google Scholar]
- Huseynov AYO, Van der Lubbe HJL, Verdegaal-Warmerdam SJA, Postma O, Sch¨röder J, Vonhof H. 2024. Novel crushing technique for measuring d18O and d2H values of fluid inclusions (H2O) in quartz mineral vein using cavity rong-down spectroscopy. Geofluids. https://doi.org10.1155/2024/579544. [Google Scholar]
- Jourdan S, Bernet M, Schwartz S, et al. 2012. Tracing the oligocene-miocene evolution of the Western Alps drainage divide with pebble petrology, geochemistry, and Raman spectroscopy of foreland basin deposits. J Geol 120: 603–624. https://doi.org/10.1086/667813. [Google Scholar]
- Kishima N, Sakai H. 1980. Oxygen-18 and deuterium determination on a single water sample of a few milligrams. Anal Chem 52: 356–358. https://doi.org/10.1021/ac50052a038. [Google Scholar]
- Krusnik E, Methner K, Campani M, et al. 2021. Miocene high elevation in the central Alps. Solid Earth 12: 2615-2631. https://doi.org:10.5194/se-12-2615-2021. [Google Scholar]
- Lagabrielle Y. 1987. Les ophiolites : marqueurs de l'histoire tectonique des domaines océaniques : le cas des Alpes franco-italiennes (Queyras, Piémont): comparaison avec les ophiolites d'Antalya (Turquie) et du Coast Range de Californie. [Google Scholar]
- Lécuyer C, O’Neil JR. 1994. Stable isotope compositions of fluid inclusions in biogenic carbonates. Geochim Cosmochim Acta 58: 353–363. https://doi.org/10.1016/0016-7037(94)90469-3. [Google Scholar]
- Leloup PH, Arnaud N, Sobel ER, Lacassin R. 2005. Alpine thermal and structural evolution of the highest external crystalline massif. The Mont Blanc: Tectonics 24. https://doi.org/10.1029/2004TC001676. [Google Scholar]
- Lemarchand J, Boulvais P, Gaboriau M, Boiron MC, Tartèse R. 2012. Giant quartz vein formation and high-elevation meteoric fluid infiltration into the South Armorican Shear Zone: geological, fluid inclusion and stable isotope evidence. J Geol Soc 169(1): 17–27. [Google Scholar]
- Leutwein F. 1970. Age des cavités à cristaux du granite du Mont Blanc. CR Acad Sci Ser IIA - Earth Planet Sci 271: 156–158. [Google Scholar]
- Marshall D, Meisser N, Taylor RP. 1998a. Fluid inclusions, stable isotope and Ar-Ar evidence for the age and origin pf glod-bearing quartz veins at Mont Chemin, Switzerland. Mineral Petrol 62: 147–165. [Google Scholar]
- Melis R, Maheo G, Gardien V, Jame P, Bonjour E, Bhandari B, et al. 2023. When rainfall trapped in fluid inclusions restores the relief of an orogen: insights from the Cenaozoic Himalaya. EPSL 613: 118185. [Google Scholar]
- Morag N, Aviga D, Harlavan Y, et al. 2008. Rapid exhumation and mountain building in the Western Alps: Petrology and 40Ar/39Ar geochronology of detritus from Tertiary basins of southeastern France. Tectonics 27. https://doi.org/10.1029/2007TC002142. [Google Scholar]
- Mulch A, Teyssier C, Cosca MA, Vanderhaeghe O, et al. 2004. Reconstructing paleoelevation in eroded orogens. Geology 2: 525–528. https://doi.org/10.1130/G20394.1. [Google Scholar]
- Mulch A, Chamberlain CP. 2007. Stable isotope paleoaltimetry in orogenic belts the silicate record in surface and crustal geological archives. Rev Mineral Geochem 66: 89–118. https://doi.org/10.2138/rmg.2007.66.4. [Google Scholar]
- Poage MA, Chamberlain CP. 2001. Empirical relationships between elevation and the stable isotope composition of precipitation and surface waters: considerations for studies of paleoelevation change. Am J Sci 301: 1–15. https://doi.org/10.2475/ajs.301.1.1. [Google Scholar]
- Poty B. 1967. La croissance des cristaux de quartz dans le filon de la Gardette (Bourg d’Oisansà et des filons du Mont Blanc. Thèse Université Nancy. 162p. [Google Scholar]
- Poty B, Leroy J, Cuney M. 1974. Les inclusions fluides dans les minerais des gisements d’uranium intragranitiques du Mimousin et du Forez (Massif central, France). In Formationof Uranium deposits. Vienna: I.A.E.A., pp. 569–682. [Google Scholar]
- Renne PR, Swisher CC, Deino AL, et al. 1998. Intercalation of standards, absolute ages and unceetainties in 40Ar/39Ar dating. Chem Geol 145: 117–152. [Google Scholar]
- Roddick JC. 1978. The application of isochron diagrams in 40Ar/39Ar dating: a discussion. Earth Planet Sci Lett 41: 233–244. [Google Scholar]
- Roddick JC, Cliff RA, Rex DC. 1980. The evolution of escess argon in Alpine biotite: A 40Ar/39Ar analysis. Earth Planet Sci Lett 48: 185–208. [Google Scholar]
- Rolland Y, Rossi M, Cox SF, Corsini M, Mancktelow N, Pennacchioni G, et al. 2008. 40Ar/39Ar dating of synkinematic white mica: insights from fluid–rock reaction in low-grade shear zones (Mont Blanc Massif) and constraints on timing of deformation in the NW external Alps. Geol Soc London 299: 293–315. [Google Scholar]
- Rossi M, Rolland Y. 2014. Stable isotope and Ar/Ar evidence of prolonged multiscale fluid flow during exhumation of orogenic crust: example from the Mont Blanc and Aar Massifs (NW Alps). Tectonics 33: 1681–1709. https://doi.org/10.1002/2013TC003438. [Google Scholar]
- Rottier B, Kouzmanov K, Casanova V, et al. 2021. Tracking fluid mixing in epithermal deposits – Insights from in-situ δ18O and trace element compositionof hydrothermal quartz from the giant Cerro de Pasco polymetallic deposit, Peru. Chem Geol 576: 120277. [Google Scholar]
- Rowley DB, Pierrehumbert RT, Currie BS. 2001. A new approach to stable isotope-based paleo-altimetry: implications for paleoaltimetry and paleohypsom etry of the High Himalaya since the Late Miocene. Earth Planet Sci Lett 188: 253–268. https://doi.org/10.1016/S0012-821X (01)00324-7. [Google Scholar]
- Rowley DB, Garzione CN. 2007. Stable isotope-based paleoaltimetry. Ann Rev Earth Planet Sci 35: 463–508. https://doi.org/10.1146/annurev.earth.35.031306.140155. [Google Scholar]
- Rozanski K, Araguas-Araguas L, Gonfianti R. 1993. Isotopic patterns in modern global precipitation. Geophys Monograph 78. [Google Scholar]
- Schwartz S, Lardeaux JM, Tricart P, et al. 2007. Diachronous exhumation of HP–LT metamorphic rocks from south-western Alps: evidence from fission-track analysis. Terra Nova 19: 133–140. https://doi.org/10.1111/j.1365-3121.2006.00728.x. [Google Scholar]
- Schwartz S. 2000. La zone piemontaise des Alpes occidentales : un paleocomplexe de subduction, Arguments métamorphiques, géochronologiques et structuraux. Thèse Université Claude Bernard-Lyon 1. 288p. [Google Scholar]
- Schwartz S, Lardeaux J-M, Tricart P, Guillot S, Labrin E. 2007. Diachronous exhumation of HP-LT metamorphic rocks from south-western Alps: Evidence from fission-track analysis, Terra Nova 19: 133–140. [Google Scholar]
- Simon-Labric T, Rolland Y, Dumont T, Heymes T, Authemayou C, Corsini M, Fornari M. 2009. Terra Nova 21: 127–136. [Google Scholar]
- Sonney R, Vuataz FD, Cattin S. 2010. Use of Cl/Br ratio to decipher the origin of dissolved mineral components in deep fluids from the Alps range and neighbouring areas. Proc World Geothermal Congress 15: 1–13. [Google Scholar]
- Vennemann TW, O’Neil JR. 1993. A simple and inexpensive method of hydrogen isotope and water analysis of minerals and rocks based on zinc reagent. Chem Geol 227–234. [Google Scholar]
- Wenner, D. B., and H. P. Taylor Jr. (1971), Temperatures of serpentinization of ultramafic rocks based on 18 O/ 16O fractionation between coexisting serpentine and magnetite, Contrib. Mineral. Petrol 32: 165–185. [Google Scholar]
- Wolf SG, Huismans R, Braun J, Uan X. 2022. Topography of mountain belts controlled by rheology and surface processes. Nature 606: 516–521. [Google Scholar]
- York D. 1969. Least squares fitting of a straight line with correlated errors. Earth Planet Sci Lett 5: 320–324. [Google Scholar]
- Zhang YG, Frantz JD. 1987. Determination of the homogenization temperatures and densities of supercritical fluids in the system NaCl-KCl-CaCl2-H2O using synthetic fluid inclusions. Chem Geol 64: 335–350. [Google Scholar]
- Zheng YF. 1993. Calculation of oxygen isotope fractionation in anhydrous silicate minerals. Geochem Cosmochim Acta 57: 1079–1091. [Google Scholar]
Cite this article as: Gardien V, Melis R, Lécuyer C, Mahéo G, Leloup P.-H, Jame P, Bonjour E, Aissa W.B, Arnaud N, Atrops F. 2026. Paleo-altimetry reconstruction based on stable isotopic composition of fluid inclusions in quartz veins, BSGF - Earth Sciences Bulletin 197: 8. https://doi.org/10.1051/bsgf/2026004.
All Tables
Results of δ2H and δ18O measurements expected and obtained for standard water samples from Cervières and Greenland. Values in red are the averages of the last four measurements. All values are expressed in.
Résultats des mesures des δ2H et le δ18O attendus et obtenus pour les échantillons d’eau standards de Cervières et du Groenland. Les valeurs en rouge sont les moyennes des quatre dernières mesures.
Micrthermometric data obtained on quartz veins from the CM (Schwartz, 2000) and MBM (this study) together with the type of quartz veins and the altitude of sampling. Tm ice = ice melting temperature, Th = homogenization temperature, L = liquid, V = vapor;%wt NaCl = sality of the fluid.
Données microthermométriques obtenues sur les veines de quartz du CM (Schwartz, 2000) et du MBM (cette étude) avec le type de veines de quartz et l'altitude d'échantillonnage. Tm ice = température de fusion de la glace, Th = température d'homogénéisation, L = liquide, V = vapeur;%wt NaCl = salinité du fluide.
Pressure – temperature conditions of entrapment of the FIs of quartz veins from the MBM (this study) and the CM (Schwartz, 2000).
Conditions de pression - température de piégeage des IFs des veines de quartz du MBM (cette étude) et du CM (Schwartz, 2000).
Average winter and summer isotopic composition of rainfall on the MBM and the CM at elevations comparable to the samples collected during our fieldwork (site waterisotopes.org). Isotopic composition of the meteoric waters collected on the MBM and the CM.
Composition isotopique moyenne des précipitations (site waterisotopes.org), en hiver et en été, sur le MBM et le CM à des altitudes comparables à celles des échantillons prélevés lors de notre campagne de terrain. Composition isotopique des eaux météoriques recueillies sur le MBM et le CM.
A- Isotopic composition of aqueous fluids extracted from the fluid inclusions quartz veins from the MBM. Two methods (thermal decrepitation and crushing) have been used to extract the fluids from horizontal, vertical and syntectonic veins and two methods (conventional and the new method developed in this study) have been uses to analyse the fluid inclusions. B - Isotopic composition of aqueous fluids extracted from the fluid inclusions quartz veins from the CM. Two methods (thermal decrepitation and crushing) have been used to extract the fluids from the vertical veins and two methods (conventional and the new method developed in this study) have been uses to analyse the fluid inclusions.
A- Composition isotopique des fluides aqueux extraits des inclusions fluides des fentes de quartz du MBM. Les deux méthodes (décrépitation thermique et crushing) ont été utlisé pour extraire les fluides des veines horizontales, verticales et syntectoniques et deux méthodes d’analyses (conventionnelle et nouvelle méthode développée dans cette étude) ont été utilisées pour analyser les inclusions fluides. B - Composition isotopique des fluides aqueux extraits par décrépitation thermique et crushing des inclusions fluides des fentes de quartz du CM et analysée par la méthode conventionnelle et la nouvelle méthode développée dans cette étude.
All Figures
|
Fig. 1 A-Location of the Western Alps, B- Simplified geological map of the Mont Blanc Massif (MBM), C- Simplified geological map of the Chenaillet Massif (CM), 67.9 ±8.5 Ma = fission-track data for zircon from Chenaillet; 22.84 ±1.15 Ma = fission-track age for apatite from the Lago Nero Schistes Lustrés (Schwartz. 2000). Localization of the samples studied: blue diamond = quartz samples, white circle = water samples. A -Localisation des Alpes occidentales, B- carte géologique simplifiée du Massif du Mont Blanc (MBM), C-carte géologique simplifiée du Massif du Cenaillet (CM); 67.9 ±8.5 Ma = âge trace de fission sur zircon du Chenaillet; 22.84 ±1.15 Ma = age trace de fission sur apatite Schistes Lustrés du Lago Nero (Schwartz. 2000). Localisation des échantillons étudiés : losange bleu = veines de quartz, cercle blanc = échantillons d'eau. |
| In the text | |
|
Fig. 2 A- field Quartz veins from the MBM (photo Y. Rolland), B- geodic quartz, C-sealed and unsealed quartz veins, D- thin sections of quartz fibers of an unsealed vein, E and F- microstructures in quartz grains of sealed veins of the MBM; G and H sealed quartz veins in basalts and sandstones form the CM; I and J- primary and secondary Fluides Inclusions (FIs) in quartz from the MBM; K- primary FIs in quartz veins from the CM. A- Veine de quartz du MBM, B : quartz géodique, C- veines de quartz cimentées et non cimentées, D - lame mince montrant des fibres de quartz dans une veine non cimentée, E et F -microstructures dans les grains de quartz des veines cimentées du MBM; G et H - veines de quartz cimentées dans les basaltes et les grès du CM; I et J-Inclusions Fluide (IFs) primaires et secondaires dans le quartz du MBM; K- IFs primaires dans les veines de quartz du CM. |
| In the text | |
|
Fig. 3 A- δ2H versus δ18O diagrams showing the mean isotopic compositions of winter and summer precipitation at identical altitudes to precipitation sampled in August on the MBM. Blue triangles = winter precipitation compositions, red triangles = summer precipitation compositions (waterisotopes.org website), blue diamond = precipitation sampled in August on the MBM. The average isotopic composition of meteoric waters sampled on the MBM during the filed survey in August is represented by the blue squarre. The data are plotted with the isotopic compositions of modern global precipitation in the Northern Hemisphere (light grey triangle) taken from Rozanski et al. (1993) and the meteoric water line calculated from these data. B–δ2H versus δ18O diagrams showing the mean isotopic compositions of winter and summer precipitation at identical altitudes to precipitation sampled in May on the CM. Blue triangles = winter precipitation compositions, red triangles = summer precipitation compositions (waterisotopes.org website), green dots = precipitation sampled in May on the CM. The average isotopic composition of meteoric waters sampled on the CM during the field survey in May is represented by the green squarre. The data are plotted with the isotopic compositions of modern global precipitation in the Northern Hemisphere (light grey triangle) taken from Rozanski et al. (1993) and the meteoric water line calculated from these data. A- Diagramme δ2H versus δ18O montrant la composition isotopique moyennes des precipitations hivernales et estivales à des altitudes identiques aux precipitations prélevées en Aout sur le MBM (diamant bleu.). Les triangles bleus = compositions des precipitations hivernales, les triangles rouges = precipitations estivales (site waterisotopes.org). La moyenne des compositions isotopiques des eaux météoriques prélevées en Aout sur le MBM est représentée par le carré bleu. Les données sont associées aux compositions isotopiques des précipitations modernes mondiales de l'hémisphère Nord (triangles gris clair) issues de Rozanski et al. (1993) et la droite des eaux météoriques calculée à partir de ces données. B- Diagramme δ2H versus δ18O montrant la composition isotopique moyennes des precipitations hivernales et estivales (site waterisotopes.org) à des altitudes identiques aux precipitations prélevées en mai sur le CM (cercles verts,). La moyenne des compositions isotopiques des eaux météoriques prélevées en mai sur le CM est représentée par le carré vert. Les données sont assoxiées aux compositions isotopiques des précipitations modernes mondiales de l'hémisphère Nord (triangles gris clair) issues de Rozanski et al. (1993) et la droite des eaux météoriques calculée à partir de ces données. |
| In the text | |
|
Fig. 4 A- Plot of the δ18O vs δ2H values of the FIs from the MBM, grey dots = vertical veins, red dots = horizontal veins, orange dots = syntectonic veins. The average values of the FIs for each veins family are represented by grey, red and yellow squares respectively. The number near the symbols refer to the altitude of the meteoric water samples and the quartz veins. Blue diamonds = compositions of meteoric waters sampled at the same elevation as the quartz veins. The δ2H values acquired by the traditional approach upon crushing are shown in the yellow area. The data are plotted with the meteoric water line for the Northern Hemisphere (GMWL) and the local metoric water (LMWL). B- Plot of the δ18O vs δ2H values of the FIs from the CM, Vertical veins are shown in green, the average value of the FIs is represented by a green square. The six veins analyzed using the conventional method are shown with purple dots. The 5 veins analyzed using the new method are represented with green dots. The δ2H values acquired by the traditional approach upon crushing are shown in the yellow area. The data are plotted with the meteoric water line for the Northern Hemisphere. A-Valeurs du δ18O et du δ2H des IFs du MBM. Les veines verticales sont représentées en gris, les veines horizontales en rouge et les veines syntectoniques en orange. Les valeurs moyennes de la composition des IFs pour chaque famille de veines sont représentées par des carrés gris, rouges et jaunes respectivement. Les données sont repontées avec la droite des eaux météoriques pour l’hémisphère Nord (GMWL) et la droite des eaux météoriques locales (LMWL), les nombres à coté des symboles indiquen l’altitude de prélèvements des eaux météoriques ou des veines de quartz La zone jaune représente les valeurs du δ2H obtenues par la méthode conventionnelle apres écrasement. B- Valeurs δ18O vs δ2H des IFs du CM, les veines verticales sont représentées en vert, la valeur moyenne des IFs est représentée par un carré vert. Les six veines analysées avec la méthode conventionelle sont représentées en violet. Les données sont reportées avec la droite des eaux météoriquex pour l'hémisphère Nord. La zone jaune représente les valeurs du δ2H obtenues par la méthode conventionnelle apres écrasement. |
| In the text | |
|
Fig. 5 Left - 40Ar/39Ar results for K-feldspar from two MBM veins (9MB11 and 9MB64) sampled at 2200 and 653 m respectively. Double arrows represent age plateaus or pseudoplateaus (see text for explanation on the calculation and use of these terms). Center - Inverse isochrones for which each step is plotted, the regression line corresponds to the calculated age. Step numbers in empty circles were not used for calculations Right - field pictures of the dated adularia. A gauche - Résultats 40Ar/39Ar pour des feldspaths potassiques de deux veines du MBM (9MB11 et 9MB64) échantillonnées respectivement à 2200 et 653 m. Les doubles flèches représentent des plateaux ou pseudoplateaux d'âge (voir l'explication du calcul et de l'utilisation de ces termes dans le texte). Droite - Isochrones inverses pour lesquelles chaque étape est tracée, la ligne de régression correspond à l'âge calculé. Les numéros d'étape dans les cercles vides n'ont pas été utilisés pour les calculs. Right: field photo of the dated adularia. |
| In the text | |
|
Fig. 6 Plot of the δ18O vs δD values of the FIs from the MBM and the CM. The veins from the MBM are represented by grey dots (horizontal veins), red dots (vertical veins) and yellow dots (syntectonic veins). The average values for each vein family are represented by squares of the same color. The grey squares plotting in the metmaoprphic water field are the data of Rossi and Rolland (2014) that calculated the isotopic composition of the fluid that generated MBM quartz, based on the δ18O value of quartz at 300 °C (light grey) and 450 °C (dark grey). The CM veins are represented by green dots. All the data are plotted with the isotopic compositions of modern global precipitation in the Northern Hemisphere (light grey diamond) from Rozanski et al. (1993) and the meteoric water line calculated from these data. Représentation graphique des valeurs δ18O vs δD des IFs des veines du MBM et du CM. Les veines du MBM sont représentées par des ronds gris (veines horizontales), des ronds rouges (veines verticales) et des ronds jaunes (veines syntectoniques). Les valeurs moyennes pour chaque famille de veines sont représentées par des carrés de la même couleur. Les carrés gris qui plottent dans le champ des eaux métamorphiques sont les données de Rossi et Rolland (2014) qui ont calculé la compositin isotopique du fluide à l’orignine de la formation des quartz à partir du 18O du quartz à 300 °C (gris clair) et 450 °C (gris foncé). Les veines du CM sont représentées par des ronds verts. Les données sont représentées avec les compositions isotopiques des précipitations mondiales modernes dans l'hémisphère Nord (diamant gris clair) de Rozanski et al. (1993) et la ligne des eaux météoriques calculée à partir de ces données. |
| In the text | |
Current usage metrics show cumulative count of Article Views (full-text article views including HTML views, PDF and ePub downloads, according to the available data) and Abstracts Views on Vision4Press platform.
Data correspond to usage on the plateform after 2015. The current usage metrics is available 48-96 hours after online publication and is updated daily on week days.
Initial download of the metrics may take a while.