")
")
Fig. 4
Download original image
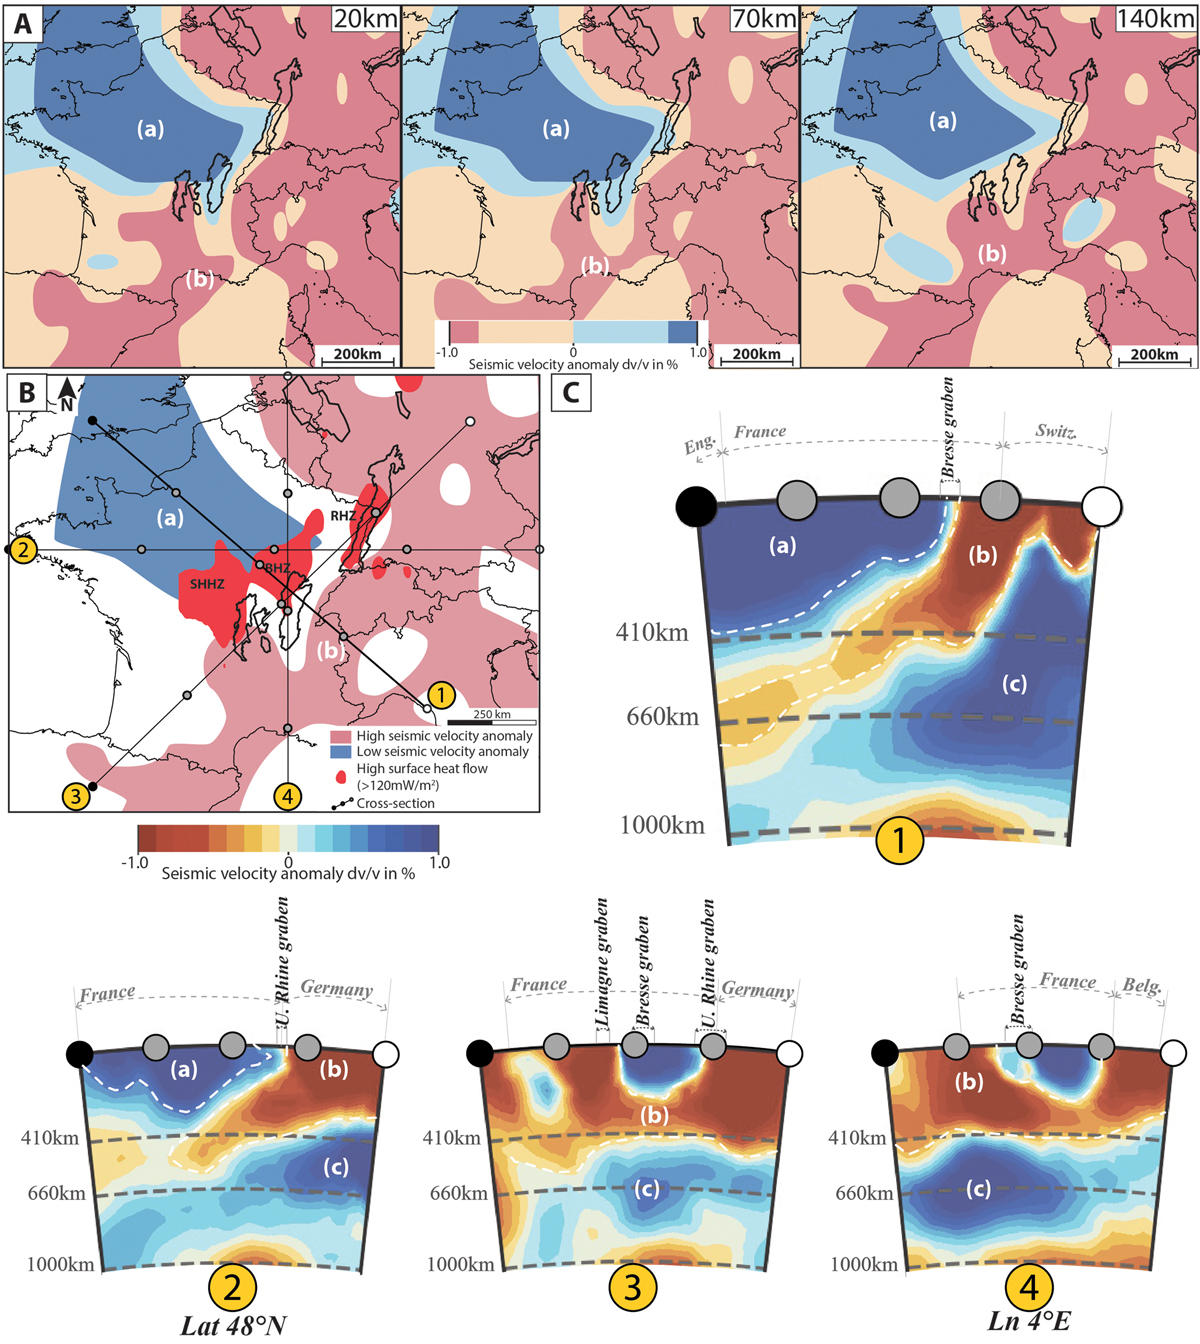
P-wave seismic tomography images centred on Upper Rhine, Bresse and Limagne Grabens (lat. 40°N to 52°N and ln. 5°W to 11.5°E, based on P-Wave model (Hosseini, 2016; Hosseini et al., 2018), A: Tomography depth-slices at depths of 20 km, 70 km and 140 km, B: Simplified map of tomography warm and cold spots. The high surface heat flow patches of Figure 3B are also reported. The lines identified with the numbers (i.e., 1, 2 and 3) represent the profiles of the sections showed in C. C: 2-D tomography cross-sections at latitude of 48, longitude of 5, and 2 diagonals passing through ECRIS rifts (cross-sections 1 and 3). The depths of the dashed lines are 410, 660, 1000 km from the surface. NAPBD: North Armorica Paris Basin Domain, RBLTZ: Rhine-Bresse-Limagne Transfer zone, NED: North ECRIS domain, SED: South ECRIS Domain.
Current usage metrics show cumulative count of Article Views (full-text article views including HTML views, PDF and ePub downloads, according to the available data) and Abstracts Views on Vision4Press platform.
Data correspond to usage on the plateform after 2015. The current usage metrics is available 48-96 hours after online publication and is updated daily on week days.
Initial download of the metrics may take a while.