")
")
| Issue |
BSGF - Earth Sci. Bull.
Volume 195, 2024
|
|
|---|---|---|
| Article Number | 1 | |
| Number of page(s) | 19 | |
| DOI | https://doi.org/10.1051/bsgf/2023016 | |
| Published online | 8 janvier 2024 | |
Landslide susceptibility mapping using GIS Matrix Method and Frequency Ratio, application in the marly context of Moulay Yacoub Region, Morocco
Cartographie de la susceptibilité aux glissements de terrain en utilisant la méthode Matrice-SIG et le Rapport de Fréquence, application dans le contexte marneux de la région de Moulay Yacoub, Maroc
1
Sidi Moahemmed Ben abdellah University, Faculty of Sciences and Technology, Geology department, B.P. 2202-Route d’Imouzzer, 30100 Fez Morocco
2
GERN, Faculty of Sciences, Abdelmalek Essaadi University, Tetouan, Morocco
3
Geotechmed Laboratory, N 256 LOTISSEMENT PREVENTION 93000, Tetouan Morocco
* Corresponding author: Cette adresse e-mail est protégée contre les robots spammeurs. Vous devez activer le JavaScript pour la visualiser.
Received:
17
January
2022
Received in final form:
18
August
2022
Accepted:
16
November
2023
Abstract
In the recent decades, the growth of population, man-made facilities, infrastructures, and lifelines at the expense of landslides-prone areas has been responsible for an exponential increase in human and economic losses in many parts of the world. In the Moulay Yacoub region, where marly hills dominate, the interaction of the semi-urban and rural socioeconomic development and landslides significantly increases, which urges identifying and prioritizing areas of risk in order to maximize harm reduction and to avoid the disastrous outcomes as is the case of Moulay Yacoub town. This paper aims to develop a landslide susceptibility map in a highly affected sector of the province, where no previous landslide data have been produced, and to find the most predisposing parameters. This goal is attained using two robust methods for landslide susceptibility mapping, the Frequency Ratio and the GIS Matrix Method. Before that, the correlation of 11 predisposing factors was tested. The results show that the anthropogenic factors, particularly the agricultural practices, were highly involved, and the field investigations proved that cereal farming slopes are the most affected. The success rate was about 0.75 (75%) for both models showing good quality results for the two susceptibility maps. Therefore, the two models could be efficiently used, and the new agricultural projects located in landslide-prone areas of the province must include such reliable methods of landslide hazard analysis to minimize the risk, which would put human lives, ecosystems, food production, and infrastructure in threat.
Résumé
Au cours des dernières décennies, la croissance de la population, des installations artificielles, des infrastructures et des lignes de vie au détriment des zones sujettes aux glissements de terrain a été responsable d’une augmentation exponentielle des pertes humaines et économiques dans de nombreuses régions du monde. Dans la région de Moulay Yacoub, où dominent les collines marneuses, l’interaction du développement socio-économique semi-urbain et rural et des glissements de terrain augmente considérablement, ce qui oblige à identifier et à prioriser les zones à risque afin de maximiser la réduction des dommages et d’éviter les conséquences désastreuses, comme est le cas du centre urbain de Moulay Yacoub. Cet article vise à développer une carte de susceptibilité aux glissements de terrain dans un secteur fortement affecté de la province, où aucune donnée antérieure sur les glissements de terrain n’a été produite, et à trouver les paramètres les plus impliqués. Cet objectif sera atteint en utilisant deux méthodes robustes, le rapport de fréquence et la méthode de la matrice-SIG. Avant cela, la corrélation de 11 facteurs a été testée. Les résultats montrent que les facteurs anthropiques, particulièrement les pratiques agricoles, ont été fortement impliqués, et l’enquête de terrain a montré que les versants céréaliers étaient les plus touchés. Le taux de réussite était d’environ 0,75 (75%) pour les deux modèles montrant des résultats de bonne qualité pour les deux cartes de susceptibilité. Par conséquent, les deux modèles pourraient être utilisés efficacement, et les nouveaux projets agricoles situés dans les versants de la province sujettes aux glissements de terrain doivent inclure des méthodes d’analyse aussi fiables, afin de minimiser le risque, ce qui mettrait les vies humaines, les écosystèmes, la production alimentaire, et les infrastructures en péril.
Key words: Landslide susceptibility / GIS Matrix Method / Frequency Ratio / Marly context / anthropogenic factors / Moulay Yacoub
Mots clés : Susceptibilité aux glissements de terrain / Méthode de la Matrice-SIG / Rapport de Fréquence / Contexte marneux / facteurs anthropiques / Moulay Yacoub
© I. Obda et al., Published by EDP Sciences 2024
 This is an Open Access article distributed under the terms of the Creative Commons Attribution License (https://creativecommons.org/licenses/by/4.0), which permits unrestricted use, distribution, and reproduction in any medium, provided the original work is properly cited.
1 Introduction
Landslides represent the most destructive geological hazard in word wide (Bao et al., 2020; Petley et al., 2005; Schuster 1996; Schuster and Highland 2001), especially in the Mediterranean rim where the environments are known by an erratic distribution of intense rainfall events, and the neo-tectonic activity is coupled with a high-energy relief (Van Beek, 2002). Sometimes, the interaction between these geo-hazards and the local practice of land use causes serious damages to infrastructures and agricultural lands and threaten local socioeconomic activities (Lee and Choi 2004; Conforti et al., 2014; Del Soldato et al., 2017; Harmouzi et al., 2019; El Kharim et al., 2021; Obda et al., 2022). According to the International Federation of Red Cross and Red Crescent Society, in the last decades, more than 3.2 million people have been affected by landslides with more than 1.700 million dollars losses (Hölbling et al., 2015). The large damaging effects of these phenomena have incited adopting several prediction strategies to identify high-risk areas that are the most vulnerable to future landslides based on local physical parameter, such as the relevant geology, geometry and slope forming processes (Fell et al., 2008). With such information, people and decision makers can foster the prioritization of slopes requiring follow-up actions and take appropriate preventive measures to spare expensive socioeconomic losses and to plan safe future development activities (Pantelidis 2011). Therefore, in the last decades, landslide susceptibility mapping has become an essential subject in international geomorphology, engineering geology and regional/urban territory planning (Bălteanu et al., 2020; Monsieurs et al., 2019; Tien Bui et al., 2019), especially since the development of GIS-aided mapping procedures has enhanced the capability of preparation of landslide susceptibility maps, thus allowing the analysis at a broad scale (Rybar et al., 2002). However, the quality landslide susceptibility mapping (LSM) depends mainly on the completeness and precision of the landslide inventory (Pereira et al., 2012; Gaidzik and Ramírez-Herrera 2021; Bounab et al., 2022) and the quality of causal factors used for modelling (Pereira et al., 2012; Mind’je et al., 2020; Cao et al., 2021).
In fact, the inventory of past occurrences remains the most influential input factor on the calculation of the spatial probability of landslide occurrence (Pereira et al., 2012; Bounab et al., 2022), which makes the landslides mapping a decisive step. Landslide inventory maps are prepared for several objectives, such as defining the location and type of landslides in the study area (Antonini et al., 2002; Cardinali et al., 2001), showing the abundance of slope movements (Degraff 1985; Guzzetti et al., 2000), determining the frequency-area statistics of slope failures (Guzzetti et al., 2002; Hovius et al., 2000, 1997; Malamud et al., 2004), and providing relevant information to construct landslide susceptibility and hazard models (Soeters and Van Westen 1996; Chung and Fabbri 1999, 2003, 2005; Guzzetti et al., 2005, 2006).
Actually, recent studies proved that a proper computation of landslide frequency-area distributions (FAD) remains an efficient tool for testing the completeness of the landslide inventory (Van Den Eeckhaut et al., 2007), quantifying the risk and estimating erosion and sediment yields (Guzzetti et al., 2002; Fu et al., 2020) as well as comparing different geomorphological contexts in terms of landslide predisposition (Qiu et al., 2020; Sahrane et al., 2022). However, good probability size distribution models can only be obtained from complete geomorphological inventories (Galli et al., 2008).
As for the conditioning factors, which are considered as the second key parameter in landslide susceptibility modelling, recent studies usually assess about ten variables considered as predisposing factors of slope instability, e.g., Lee and Choi, 2004 (15 variables); Van Den Eeckhaut et al., 2010 (9 variables); Byou et al. (2020), (11 variables). However, most LSM studies, especially those published before the 2020s, tend to mainly focus on the effects of different statistical techniques used to calculate the landslide susceptibility model and to validate its goodness of fit without assessing the correlation rate between landslides and the variables chosen (e.g., Süzen and Doyuran 2004; Schicker and Moon 2012; Kavzoglu et al., 2015; Othman et al., 2015; Aditian et al., 2018). Moreover, the choice of these parameters (data of influencing factors) could depend on the spatial extent of the study area, where a local spatial scale requires more accurate input data (Zêzere et al., 2017) as compared to a regional scale, where the choice of input is more generalized (Thiery et al., 2007; Holec et al., 2013). However, the selection step of these influencing parameters requires a geomorphologic synthesis by experts of the geomorphological context of the study area to achieve data consistency and to avoid objective evaluation of landslides spatial susceptibility (Chung and Fabbri 2005; Bounab et al., 2022). This could provide physical explanations of the observed statistical correlations and contribute to advancing our understanding of the underlying physical processes controlling the evolution of hillslopes.
Two types of approaches are commonly used to perform the landslide susceptibility maps, qualitative and quantitative methods. Each of the latter has both advantages and drawbacks (Li et al., 2017). Qualitative approaches are based on the expert point of view (Akgun 2012; Bourenane et al., 2015; Chabok et al., 2019; Demir et al., 2013; Pourghasemi et al., 2012; Zhou et al., 2016), who should have enough knowledge about the local conditioning factors involved in landslides manifestations. Quantitative methods are based on the analysis of the functional relations between the factors of instability and the distribution of landslides and can be categorized into bivariate and multivariate methods. In the bivariate ones, each factor is combined with the landslide distribution map. As for the multivariate approaches, they are usually more adapted to irregular data distribution (Kavzoglu et al., 2014).
In the Rif Mountain belt, Northern Morocco, landslides are amongst the most frequent natural hazards and are considered as a major risk to the socio-economic development of the country after floods and droughts (WBG 2021). Besides, the high energy relief and the lithological factor, dominated by loose formations, combined with human practices made landslides very abundant (Mastere et al., 2013; Rouai and Jaaidi 2003; Tribak 1997), especially in the region of Moulay Yacoub-Fez-Taza, where the lithology, represented by weathered clays and marls, combined with steep slopes and water saturation are the main factors involved in slopes instability (Hassan et al., 2015). However, the study of the anthropogenic factors (especially the land use) and their impact on landslide occurrence in the Moroccan territory (especially in the Rif mountain belt) is uncommonly investigated while international studies focusing on this important topic have increased exponentially since the 1960s (Beguería 2006; García-Ruiz et al., 2010; Guns and Vanacker 2013; Notti et al., 2015), with most irrigation-induced landslides occurring in dry climates (Chevesich et al., 2021). Following this, recent studies have shown clear evidence of a strong and increasing control of the land use practices, especially the land cover change, agricultural activities and even urban extension, on landslide occurrence (Chevesich et al., 2021; Guns and Vanacker, 2013; Obda et al., 2022). Therefore, the integration of this parameter cannot be omitted in the landslide hazard analysis. Furthermore, landslide susceptibility analysis in the Pre-Rif region is still very poorly investigated. Recently, projects of construction of aptitude for urbanization maps launched by the ministry of the national territory planning aim to provide the whole of the Moroccan territory with reference documents making it possible to consider the dimension of the risk of natural disasters, including the landslide hazard, during the urban planning process and particularly, during the development phase of the various urban planning documents. The later cannot be established without basic expertise and analysis of landslide susceptibility in predisposed areas.
The aim of the present study is first, to create a landslide database and to identify the characteristics specific to the regional study context and which have a direct impact on the predisposition of slopes to landslides. The second goal is to develop a landslide susceptibility map for the first time in the MY region, whose slopes are widely affected. Thus, future prevention measures could be proactive and efficient. To achieve this, we have chosen two among the most robust and accurate methods used in landslide susceptibility studies. The bivariate statistical Frequency Ratio (FR) method is one of the effective and widely used processes in landslide susceptibility mapping. It provides better understanding of the influence of the factors selected (whether geomorphological, climatic or anthropogenic) on landslide occurrence (Razavizadeh et al., 2017; Vakhshoori et al., 2016). Moreover, the FR outperformed many other methods in landslide susceptibility mapping (Weights of evidence, Fuzzy gamma model, Support vector machine, Evidence belief function, etc.) in terms of accuracy (Huang et al., 2018; Vakhshoori et al., 2016) and the ease of data manipulation in a GIS platform (Zhang et al., 2020). On the other hand, the landslide susceptibility results pointed out the quality of the maps drawn by means of the GIS Matrix Method (GMM) in comparison with those made by other bivariate-statistical techniques (Perálvarez et al., 2009) and those made by the multiple-regression method (Irigaray et al., 2007). Its application showed satisfactory results and can be tailored for a broad scale where the same predisposing factors prevail (Irigaray et al., 2007; Boualla et al., 2019) which constitutes a similar context of our study area. In this study, we opted for these two models because in addition to the satisfactory results they provide according to the authors cited above, the FR method is counted among the most frequently used models, vice versa, the matrix method is still very little used in the modelling of landslide susceptibility, which encouraged us to test it and compare its results with the FR method in a specific and highly landslide-prone area as the MY province.
2 Material and methods
2.1 Study area
The study area is located in the west part of Moulay Yacoub province (MY) northern Morocco (Fig. 1), and includes 3 rural municipalities: Mikkes, Sebt Loudaya and Laajajra. The total area covered is 335 km2. MY province occupies the extreme south of the Pre-Rif unit (sub-unit of the Rif belt) and is limited to the south by the South-Rif overlapping front, which separates the Pre-Rif from the plain of Saïs (Fig. 1). The Pre-Rif consists of marly overthrust nappes that belong to Cretaceous and Tertiary ages (Sendide 2002; Winckel 2002; Lakhdar et al., 2006; Charroud et al., 2007). The marls domination affords to the region a landscape of hills with 5 to 20% average slopes. The highest hills rarely reach 900m altitude and are usually armed with sandstone or limestone ledge. The observed processes of water erosion (sheet, rill and gully erosion) reveal the relative soils impermeability, their friability and the strong surficial flow (Heusch 1970; Tribak et al., 2009).
The drainage pattern is non-perennial and quite dense. Moreover, the study area is known by subarid climatic conditions with an average of 314 mm of annual precipitations. Rainfall data of Fez and MY’s hydraulic stations show that most precipitations fall as stormy rain events, sometimes exceeding 50 mm, during very short periods (2 to 10 days), which expresses a severe seasonal contrast (DGM Moulay Yacoub; Obda et al., 2022). For the structural geodynamic of the region, the last studies confirmed recent tectonic activities at this Southern-Rif border (Agharroud et al., 2021; Chalouan et al., 2014; Poujol et al., 2017).
The main activity of the population in MY province, which does not exceed 200 000 residents (RGPH, 2014), is the agriculture which is primarily based on cereal farming and olive tree plantation. The housing regime is mostly rural except for the municipality of MY where the urbanization is closely linked to touristic and commercial activities provided by the existence of the thermal springs.
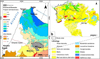 |
Fig. 1 a Geological map of northwest Morocco: (CQ) continental quaternary, (NSR) Neogene South-Rifan corridor, (NV) Neogene volcanism, (PR) Prérif, (MR) Mesorif, (INR) Intrarif, (F) flysch unit, (IR) Internal Rif, (M) Mesozoic blanket, (CM) Caledonian western Meseta, (TF) Frontal thrust; b Lithological map of the MY province. |
2.2 Landslide inventory
In the province of Moulay Yacoub, no slope movements data have been developed previously. The inventory map was established according to the classification of Hungr, 2014, who proposed a more detailed update to the Varnes classification. The landslide mapping was based on geomorphological field mapping, on visual interpretation of the aerial photos of the 1991 and 2005 missions at a scale of 40000 and 30000 respectively, and on the use of imageries like Google Earth and Bing maps, where most of landslides were mapped on the December 2018 image. Then, seven field investigation surveys were conducted in February 2020, July 2021, and October 2021 to check and validate concealed processes by land cover (especially brushwood and trees), and relatively eroded ones. Earthflows, slides, and rock falls were observed and inventoried in the study area (Fig. 2a). However, since rock falls are fairly localized, particularly at the foot of a few rocky escarpments, they were discarded from this study.
The term earthflows is used because their materiel is composed of marly soils (fine-grained material), has a flow-like surface morphology (Appendix 2), is essentially ductile and does not significantly lose strength during deformation (Hungr et al., 2014; Varnes et al., 1996). As a result, earthflows move slowly and intermittently without requiring steep slopes to be triggered (less than 12°) (Schuster et al., 1996). In fact, they have long periods of relative dormancy alternated with more rapid “surges”, allowing infrastructure and man-made projects to be built on them (Picarelli et al., 2005; Hungr et al., 2014).
 |
Fig. 2 a. Key characteristics of the landslide database. a. landslide inventory map; b. occurrences of earth flows by area of the movements; c. occurrences of slide by area of movements; d. Double Pareto, and Inverse Gamma models with frequency area distribution of the landslide inventory. |
2.3 Area-Frequency distribution analysis
Nowadays, modelling landslide size distribution is considered as essential in quantitative hazard and risk assessment because of the assessment dependency on the relationship between landslide size and frequency distribution (Corominas et al., 2008; Malamud et al., 2004). Moreover, several studies in the last decades have shown that landslide populations exhibit some power-law scaling across a portion of their size distribution (Guzzetti et al., 2002; Malamud et al., 2004; Brunetti et al., 2014; Li et al., 2016; Qiu et al., 2020; Sahrane et al., 2022). In fact, the tail of landslide size probability distribution for medium and large landslides is a power law where α controls the power law decays for medium and large landslide sizes, while β controls the maximum probability density of landslide distribution in square kilometres, and γ controls the rate of decay for small landslide areas in square kilometres. In addition to its ability to characterize the size distribution of the landslides affecting the slopes of the study area, the probability size distribution also helps to assess the completeness of the landslide inventory carried out (Eeckhaut et al., 2007; Guzzetti et al., 2002; Li et al., 2016). In the present work, an Area-Frequency distribution analysis will be carried out to check the completeness of the landslide inventory but also to investigate further how the land use practices affect the size of landslides in the study area. This will give us a better understanding of the role of vegetation types in landslide occurrence (Guns et al., 2014), which is essential to integrate the land use practices in the protection programs against the landslide risk in the region.
2.4 Landslide influencing parameters
Many factors have been used to establish landslide susceptibility maps (Catani et al., 2005; Wang et al., 2012). There are two types of involved factors in the occurrence of landslides, intrinsic and extrinsic factors. The first type is directly connected to slope instability, as the types of terrain, the presence of discontinuities, to the morphology of the slopes and to the hydrological conditions. The second type includes rather triggering factors such as intense rainfall, earthquakes and anthropic activities (railway or road constructions, mining, deforestation, drilling, different uses of lands, etc.) (Crozier 1984; Hansen 1984). For this study, the factors taken into consideration were those where data and maps were available. In the first step, slope, aspect, elevation, curvature, surface roughness, topographic wetness index (TWI), proximity to drainage network, proximity to roads, proximity to faults, lithology and land use were selected as the involved parameters of landslide influence in this study (Appendix 1). The first six factors have been calculated from the 12 meters DEM downloaded from ALOS-PALSAR platform, using GIS software. Lithology and faults were digitised from the Fes-Ouest geological map. As for the land use, roads, and the hydrographic network, they were extracted from the topographic maps and have been detailed on google earth imagery. The aspect has an impact on hydrological phenomenon, evapo-transpiration, it governs soil moisture, vegetation and grass, and root penetration. Therefore, slope aspect has an indirect link on landslide occurrence and its degree of susceptibility (Neuhäuser et al., 2012; Pourghasemi et al., 2018). Moreover, recent susceptibility mapping studies have shown that surface roughness proves to be an important parameter with a strong influence on the landslides occurrence (Komac 2006). As for the TWI, it is usually used to study the on-going hydrological processes of the sub soils. The topographical character of the terrain directly affects the soil moisture, which is considered as a conditioning parameter of shallow gravitational processes, and is recently used for their forecasting (Marino et al., 2020). To calculate the values of the index of the topographic moisture index we can use spatial data, namely the digital terrain model (Krivoguz and Bespalova 2017). This prompted us to evaluate the correlation of these parameter with landslide occurrence. Table 1 summarises the class range chosen for each parameter.
After selecting the influencing parameters in slope instability, a geostatistical connection between these parameters and each landslide type was estimated by analysing the association coefficients of contingency tables (Tab. 1). Then, a cross-tabulating of each factor grid layer and the landslide vector layer was analysed using SPSS statistical software to quantify the relative correlation. This step allows, on the one hand, to select from the factors previously considered as those which most contribute to each movement type giving rise to the landslides inventoried, and to square parameters that faintly influence the instability on the other. Good-man-Krustal’s Gamma (G-K) and Pearson’s R were the two correlation coefficients calculated (Davis 1973; Goodman and Kruskal 1979). The predictor variables are classified as “effective” (EFF) if the condition G-K index > 0.5 and R > 0.4 applies, and as “non effective” if it doesn’t (Fernández et al., 2003; Costanzo et al., 2012).
Despite that the cross-correlation were carried out for each landslide type, the G-K and R coefficients showed close values for earthflows and slides (Tab. 2). Therefore, the susceptibility maps were developed for the two landslide types combined.
Sample of the landslide-susceptibility matrix considering all the slope movements in the study area: Cm: combine number whose line shows the numbers of each class factor, Lith: lithology, Ele: elevation, Ds-ri: distance from river, Lu: land use, Sl: slope, Ds-ro: distance from roads, Twi, topographic wetness index, Rgh: slope roughness, LSM%: percentage of landslide susceptibility matrix, LS: landslide susceptibility.
Contingency tables showing the total surface (class pixels) and its percentage (% Class pixels), the affected surface by landslides (L. pixels) and the percentage of the latter (% L. pixels) of each class factor; The main factors classes which are strongly affected are underlined.
G-k and R values showing the correlation degree of the pre-selected conditioning factors with landslide types; R: Pearson R coefficient, G-K: Goodman and Kruskal coefficient.
3 Modelling of landslide susceptibility
3.1 GIS Matrix method (GMM)
The GMM is based on the construction of three matrixes in which the following data are recorded (Irigaray 1995; Chacón et al., 2006):
The first matrix TSM (Total Surface Matrix): was calculated by computing the selected factors as effective parameters, making all possible combinations among the selected factors, and then calculating the area occupied by each combination.
The second matrix LM (Landslide Matrix): was calculated by cross tabulating the reclassified landslide inventory binary map with the first resulting matrix TSM, this step allows us to calculate the area affected by landslides for each unique combination. (Irigaray et al., 2007),
The third Matrix SM (Susceptibility Matrix): is the result of dividing the LM by the TSM, the results can be calculated by a percentage that represent an assessment of relative susceptibility levels (0<LSM<100).
Then, the matrix of susceptibility (SM) is established from these data where the percentage of each of the combinations occupied by rupture zones for each type of movement is recorded (Tab. 3). The higher the percentage, the more susceptible is the corresponding combination of factors to landslide phenomena (Fernández et al., 2003). Finally, the values obtained are visualized showing 5 susceptibility levels (very low, low, moderate, high, very high). Moreover, it should be noted that there are no statistical rules for automatically categorizing continuous data. So, most researchers use their own expert opinion to develop class boundaries (Ayalew et al., 2004; Chaudhary et al., 2016). In our case, the landslide susceptibility levels of the GMM map were categorised using the Quantile method (groups that contain an equal number of values).
3.2 Frequency ratio method (FR)
In order to investigate landslide susceptibility at medium and small scales, statistical methods are the most frequently adopted approaches (Yalcin et al., 2011). Frequency ratio is one of the statistical methods frequently used (Lee et al., 2006; Pourghasemi et al., 2018; Yalcin et al., 2011). The FR method estimates the area correlation of landslide occurrence with each of the landslide-inducing parameters (Kannan et al., 2013). The reclassified factor maps were combined with the inventory map to calculate the frequency ratio of each factor class according to the equation below (Youssef et al., 2015). The higher it is the more it represents a positive correlation and high landslide susceptibility. In other words, if the FR is greater than 1, it means that a high association exists between slide locations and different classes, and a value lower than 1 means lower correlation.

with FR = frequency ratio of class i of factor j, Np (LXi) = number of pixels with landslides within class i of factor variable X, Np (Xj) = number of pixels within factor variable Xj, m = number of classes in the factor variable Xi, n = number of factors in the study area.
The Landslide Susceptibility Index (LSI) represents the relative susceptibility or hazard to landslide occurrence. To obtain the sliding susceptibility index, each factor’s frequency ratio values were summed to the training area as in the equation below (Yalcin et al., 2011; Hong et al., 2017; Sun et al., 2018). The higher LSI value indicates higher susceptibility to landslide. As or the landslide susceptibility levels of the FR map, they were categorised using Natural bricks method

3.3 Validation of susceptibility maps
The results quality assessment is an essential step in any mapping of susceptibility and/or hazard. In this research, the quality-control of the landslide susceptibility maps were assessed through the cross correlation between these maps and a previous inventory composed of 200 instability movements. In each case, two robust validation methods were used:
(i) In the first method, the degree of fit or concordance (DF) was determined (Goodchild 1986). This statistical method has been used and judged valid by several researchers studying instability movements (Chacón et al., 2006; Zieher et al., 2016; Boualla et al., 2019). The degree of fit was obtained according to the following equation:

where Zi is the area occupied by the landslide at each susceptibility level and Si is the area of the i class of susceptibility.
For DF results, the lower the values in the low and very low susceptibility classes and the higher the values in the high or very high susceptibility classes, the higher the quality of the susceptibility map (Fernández et al., 2003; Irigaray et al., 2007; Boualla et al., 2019).
(ii) The Area Under the ROC Curve (AUC) was the second validation approach. it is used to assess the performance of the statistical model, and larger AUC is considered better (Zhou et al., 2018). The AUC estimates the quality of the statistical model by describing its power to predict the occurrence or non-occurrence of landslide events (Feizizadeh and Blaschke 2013). Values close to 1 (100%) show excellent prediction, conversely if it is around 0.5 (random fit).
4 Results and discussion
4.1 Landslide inventory
In the study area, 1113 earthflows and 843 slides were identified (Fig. 2a), which expresses a total sliding surface of 17,74 km2. Panels b and c of the same figure shows that for both landslide types, earthflows and slides, small size and therefore shallow movements (<10000m2) are much more common. This is undoubtedly controlled by the predisposing factors specific to the regional context of the study area.
The statistical analysis of the landslide inventory shows that the most affected slope gradient is the range of 10−15° with 1003 movement which represents 51% of the total occurrences (Fig. 3a). This suggests that, in the context of the study area, the moderate slopes of the MY’s hilly landscape are steep enough to be prone to slope movements, which, according to the landslide inventory, are shallow processes. Moreover, the relatively low occurrences in steeper slopes (>20°) can be explained by the fact that the latter promote more surficial water erosion (gullying) as strong inclinations may not allow enough infiltration to saturate the shallow marly layer. As for the material affected, about 1250 movements affects marly slopes and 484 were mapped in the calcareous marls, corresponding to respectively 63% and 25% of total occurrences (Fig. 3c). This means that the MY marls are the most prone to slope movements probably giving their low carbonate content compared to the calcareous marls and which seems to provide higher cohesion to the latter.
Furthermore, earthflows represent 57% of the total sliding area. Field investigation showed that most of them occur in cereal farming slopes (Fig. 4 and Appendix 2). The later alone represents 92% of the area affected by all the landslides, corresponding to 1637 movements (Tab. 1 and Fig. 3b), although the seasonal agricultural activity has erased morphological features of several landslides, especially the shallow ones. However, earthflows could be instantly reactivated after heavy rain events (Bardi et al., 2017). These results suggests that cereal-growing areas not only promote landslides, mostly shallow ones since they are more dominant according to the movement size analyses (Fig. 2b, c and d), but also represent a determining factor in the predisposition to shallow landslides.
As for the slides, they represent 43% of the movements mapped. Field visits show that many slides affect the road network which means that the latter is suspected of being a significant influencing parameter in slides triggering. Moreover, several cases of compound slides were inventoried in the field and by photo interpretation. The multiple scarps along the sliding area attest that the these movements occur along multiple rupture surfaces, which is commonly encountered in soft lithologies (Hungr et al., 2014; El Kharim et al., 2021; Obda et al., 2022). Furthermore, few large and eroded slides are observed in the region, the oldest ones are not included in the present study presuming that the parameters involved in their activity are not the same as today (Guns et al., 2013). The case study of slides investigated in MY town (east of the study area) develop with rotational components (circular rupture surface), showing prominent main scarp and back-tilted landslide head (Hungr et al., 2014). They are usually very to extremely slow (few mm per year) with short acceleration events (El Kharim et al., 2021; Obda et al., 2022).
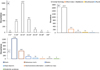 |
Fig. 3 Landslide influencing parameters in the study area. |
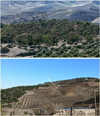 |
Fig. 4 Histograms reveal the landslide occurrences by slope ranges (panel a), land use sub-classes (panel b) and by material involved (c). |
4.2 Quality assessment of LIM
As for the assessment of the quality and the completeness of the landslide inventory, the probability size distribution of the landslides seems to be well fitted with the double pareto and the three-parameter inverse-gamma models (Fig. 2d). The rollover is well presented, and the power law does not exhibit a heavy tailed behaviour, which means that landslide inventory is quite complete for both ranges, small size/shallow (<104 m2) and large/deep landslides (>104 m2) (Qiu et al., 2020; Sahrane et al., 2022) . The quality of these results is quite comparable to the completeness assessing of landslide inventories in Eeckhaut et al. (2007); Fausto Guzzetti et al. (2002), and Tanyaş et al. (2019). Furthermore, the landslide size ranges are between 80 and 316,200 m2. As for the rollover effect (representing the most frequent landslide range), it is observed at 800 m2, which show that the small size landslides are much more frequent. This could be related to differing environmental conditions such as lithology, slope, aspect, and land use practices. This will be statistically evaluated in the section of factor’s correlation analysis.
4.3 Factors correlation analysis
After relating each factor class to slope movements distribution in the contingency tables (Tab. 1), the correlation assessment between the factors and the landslides has been performed. Table 2 shows the correlation coefficients (G-K and R) for each factor previously selected. The two factors that have been discarded are the aspect and the curvature, whose correlation coefficients are not high enough to say that these parameters play a determining role in the landslide hazard (G-K<0.5 and R<0.4). The hilly landscape of the region could be responsible for the low correlation value of the aspect parameter, as the low slope gradients mean that there is not a great difference in exposure to rain or sunlight, which generally affects the hydrological properties of the surface layer. The other influencing parameters are listed according to a decreasing order of the R of Pearson absolute value, which does not vary too much showing a moderate to high correlation for all the effective factors. Unlike that, the G-K values indicate a weak to medium correlation for some factors (land use, lithology, dist. from rivers, elevation) and a medium to strong correlation for others.
Slope angle is among the more effective instability factors for all the 3 landslide typologies, having a fairly high G-K and R values (G-K ≥ 0.6). In fact, slope gradient, faults-proximity, elevation, and distance from rivers are strongly connected parameters. In active mountain belts, such as the southern border of the Rif unit (as mentioned before), elevated hillslopes respond to an intense fluvial incision and slope adjustment which generates landslides to compensate for the oversteepening who increases the vertical component of gravity (Donati and Turrini, 2002 and Korup et al., 2010). This domino-effect results in the fact that these 4 parameters usually appear as controlling factors especially in the context of collision belt as the Rif. In the study area, the correlation values of the elevation and the distance to faults are not that high. However, the landslide affected area of the last factor shows that most landslides occur in the first 200 meters from the faults (Tab. 1) attesting that there is an influence even if it is not direct, it can be through a domino effect as mentioned above. As for the slope and the proximity to rivers, the correlation values clearly express their effective role in the landslide occurrence. However, the landslide affected area of the river proximity factor shows that most these gravitational processes occur uphill, at the furthest part from watercourses (>400m, Tab. 1). Such values mean that bank undercutting may not always be a causative factor for the landslides mapped although the strong correlation values. Otherwise, the other ranges of watercourse’s proximity would not have such weak values. On the other hand, the high corelation of the slope parameter confirms the results of the LIM analyses section where moderate slopes promote landslide occurrence while steep ones are prone to gully erosion.
Surface roughness and TWI are also among the main causative factors in our case showing medium G-K values (0.5<G-K<0.6) and slightly high R values (R >0.6). Surface roughness is considered as a significant conditioning factor in LSM (Abdulwahid and Pradhan 2017). In the specific case of landslides, the study of Eeckhaut et al. (2005) have shown that surface roughness can be used to identify landslides shape and estimate their relative age or create an assets landslide map. As for the TWI, it is used to quantify the effect of local topography on hydrological processes and modelling the spatial distribution of soil moisture and surface saturation (Qin et al., 2011). In several landslide susceptibility studies, the TWI appears among the main causative factors (Costanzo et al., 2012; Sun et al., 2021), which highlights the effect of soil moisture and surface saturation on landslide occurrence. This supports the correlation results, since the texture and the hydrological properties of the shallow layers are directly linked with the human practices in our case, and the cereal farming terrain shows the highest affected area (Tab. 1).
The road proximity and the land use are considered as anthropogenic controlling factors that promotes landslides occurrence in this study. The effects of roads and/or trails on slope stability can be summarised as (i) alteration of the natural hydrologic pathways, (ii) undercutting of unstable slopes, and (iii) overloading and oversteepening of the hillslopes (Sidle and Ochiai 2006; Guns and Vanacker 2013). Moreover, field investigations showed that landslides are often associated with bad road drainage and slope oversteepening, which explains the high R values for road proximity despite the limited road network in the MY province. For the land use, the G-K values are slightly weak, but the R ones are the highest. Land cover change induced by human activities significantly controls landslide patterns in the monotonous context of MY, as vegetation influences slope stability. In fact, vegetation modifies the hydrology of the subsurface (unsaturated zone) by controlling the impact of precipitation and evapotranspiration which affect the amount of water stored in the subsoil. Moreover, roots increase water infiltration and soil hydraulic conductivity (Beguería 2006). This explains why shallow movements are mostly found on cereal-growing slopes while wooded areas present relatively deeper processes (Appendix 2 and 3). Vegetation also has a mechanical effect on the subsoil as roots create an apparent cohesion via root fibre reinforcement that promotes slope stability (Roering et al., 2003; Schwarz et al., 2010). Consequently, the conversion from wooded areas to pastures and agriculture lands results in a rapid decline of the sub soil cohesion. According to Rogers and Selby (1980) study, forms of instability begin to manifest after 3 to 5 yr, which corresponds to the time it takes for roots to decay. This is well observed in the study area where field investigation and statistical analysis show that significantly fewer landslides are observed in forests, arboriculture zones and brushland compared with cereal farming areas (Fig. 4 and Tab. 1), knowing that the latter are much more dominant (83% of the total surface). In a recent study (Guns et al., 2013), the analyses of soil physical properties in natural forest soils showed that the saturated hydraulic conductivity is very high (estimated to be 500 mm/h) and the bulk density is very low (0.35 ± 0.13 g/cm3). Also, the observation of high porosity in the forest soils (87 ± 5%) indicates that water can easily infiltrate and percolate through the solum, which reduces the soil wetness and the landslide activity. Thus, in our case, the practice of cereal farming to the detriment of forests and brushland constitutes an effective role in the exposure of slopes to landslides by promoting water infiltration in the sub-surface, which after stormy rain events, triggers shallow movements.
As for the lithology, despite the low G-K value, the R ones are slightly high (Tab. 2). This parameter is considered among the main controlling factors in landslide susceptibility. Moreover, the low G-K values obtained for lithology do not reflect the real weight of this factor and may even lead to it being underestimated. In the present case, most of the slopes are covered by marls and calcareous marls (equivalent to more than 50% of the total area) which reveals the monotony of the lithological factor in the region. Moreover, 64% of the affected area is part of the marls class and 23% of the calcareous marls class. Which means that these two marly formations represent 87% of the landslide affected area. This leads us to believe that the lithological factor has a very effective role in landslide occurrence. Therefore, to estimate the real weight of this parameter, it is necessary to consider the old, inactive, and eroded landslides that affected the slopes, which are difficult to identify, especially when the weathering and the agricultural practices conceal the topographic features of these mass movements. Furthermore, most of these large and eroded landslides are very old and the factors (except the lithology) involved during their period of activity are not the same as today (especially the faults activity and its related parameters), for the reason that the landslide controlling factors are not fixed in time (Guns et al., 2013). However, if some factors are losing weight, the importance of other anthropogenic landslide controlling factors is increasing strongly and cannot be omitted in landslide hazard analysis. Which is the case of the current study where the installation of the road network and the land cover conversion from forests and brushwood to cereal crops are among the most influencing parameters in landslide occurrence.
4.4 FAD analysis of the land use parameter
The statistical analysis of the influence of the dominant vegetation on landslide occurrence using the probability size distribution have shown that:
Small size/shallow landslides occurring in cereal farming slopes have an area of about 80 m2 while for the olive tree slopes, the smallest landslides have an area of about 250 m2 (Fig. 5)
The rollover-effect, representing the area of the highest occurrence density, occur at 630 m2 in cereal farming slopes and at 1000 m2 at olive growing slopes
The power law decay of landslide distribution decreases earlier for the cereal farming compared to olive growing, which decreases at a larger landslide size. Moreover, the first decreases more rapidly with an α (angle controlling the power law decay for medium and large landslides) equal to 1.2, while the second decreases with an α of about 1 allowing the power law decay toward larger landslides.
Therefore, based on FAD results, the cereal farming activity promotes more the small size landslides than the olive growing. On the other hand, landslide events occurring in slopes with olive trees, as the main vegetation type, are significantly larger. These findings support the discussions in the previous section. Thus, we can assert that, in the homogenous context of MY province, land use practices control the landslides magnitude and hence their typological difference as:
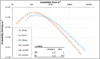 |
Fig. 5 a shows the abundant active shallow landslides affecting several cereal farming slopes. |
4.5 Susceptibility maps
The landslide susceptibility maps for both GMM and FR methods are presented in Figure 6. From a general comparison, the map resulting from the GMM method shows that very low susceptibility levels cover much more areas compared to the map of the FR method Table 4. On the other hand, areas of low and moderate susceptibility levels cover more areas in the FR map. As for the high and very high levels, they cover comparable surfaces.
A cross-comparison between the causative factor maps and those of the landslide susceptibility at a detailed scale have yielded some interesting conclusions about the direct impact of some factor classes on landslide susceptibility. A first observation shows that the valleys and the beds of the wadis have a very low susceptibility to landslides, especially in the GMM map. On the other hand, areas with high susceptibility are featured in the moderate and steep slopes which explains the strong correlation of the slope parameter. Regarding the lithology, the slopes dominated by marls and calcareous marls show high susceptibility levels while shales, saliferous clays and sandstone-marls outcrops seem to significantly increase the slope stability (Appendix 1 and Fig. 6). Moreover, for the land use, the orchards and the brushwood seem to directly reduce the susceptibility level of the areas they cover, especially in the GMM map (Fig. 7). Unlike that, most terrains of high and very high landslide susceptibility are dominated by cereal farming. This corroborates what was previously mentioned about the consequences of land cover conversion from natural forests, orchards and brushland to pastures and cereal farming on the exposure of slopes to landslides in the study area. Another interesting observation shows that badlands also reduce the landslides susceptibility level of the slopes (Fig. 7). Badlands are geomorphological processes that consist in the mobilization of the parent rock downslope by water erosion. They are characterized by steep slopes, minimal vegetation, and high drainage density. Moreover, they inhibit the agricultural use and are devoid of shrubs and grasses that prevent water erosion and infiltrated run-on water during rainfalls (Howard 2009), which promotes surface water erosion more than other instability phenomena such as landslides. The latter require water infiltration and moisture storage of the sub surface to be triggered (Chevesich et al., 2021).
 |
Fig. 6 Double Pareto, Inverse Gamma and frequency area distribution of landslide inventory in cereal farming and olive trees slopes. |
Covering area for each landslide susceptibility class presented by the FR (left) and GMM (right) maps.
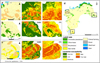 |
Fig. 7 Landslide susceptibility maps with the location of movements used for validation, a GIS Matrix Method map, b Frequency Ratio map. |
4.6 LSM validation
The DF values for the very low and low susceptibility classes are 2% and 11% respectively for FR and GMM maps while the values for the high and very high susceptibility classes are 87,3% and 68% respectively (Fig. 8). In fact, the quality of these landslide susceptibility maps tested by the degree of fit method shows good values for each landslide susceptibility map, with a slight advantage for the FR method.
As for the AUC curves, they were plotted based on the number of correctly classified pixels (true-positive) and the number of the incorrectly identified pixels (false-positive). The AUC values for FR and GMM methods were estimated as 0,743 and 0,752 respectively (Fig. 8). These comparable results show effective landslide susceptibility modelling, knowing that AUC values between 0.7 and 0.9 indicate good discrimination ability (Swets 1988).
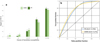 |
Fig. 8 Noticeable impact of land use sub-classes in mitigating landslide susceptibility level of both maps FR and GMM; a effect of brushwood, b effect of orchards, c effect of Badlands and brushwood, d location of the zooms a,b and c in the land use map. |
5 Conclusion
In the present work a detailed analysis of the LSM input database were conducted before computing the susceptibility models in order to investigate how the causative factors impact the landslide size-distribution and hence the hazard. In fact, the anthropogenic factors turn out to be among the most effective influencing parameters in MY region where the cereal farming areas dominating the MY region were highly affected and promoting small scale and shallow movements. The landslides mapped in olive trees slopes and brushland were larger and hence deeper processes. This highlights the role of human practices such as land cover conversion from forest, arboriculture areas and brushland to cereal farming crops in controlling the landslides magnitude and typology. Apart from that and based on the statistical analysis, TWI, slope roughness, lithology, slope gradient, elevation and faults proximity are all effective parameters promoting landslide occurrence in the study area.
Moreover, we tried to map the susceptibility to landslides in a geomorphologically homogeneous context, where influencing factors are monotonously repeated over almost the entire study area. In this case, the most efficient method is the one that is less influenced by this homogeneity and gives liberating results with a little detail, this is recently asserted in Sahrane et al. (2022a,b). Thus, according to the results of the susceptibility maps produced (Fig. 6 and Tab. 4), the FR model seems to amplify the level of susceptibility and is less influenced by the variation of factors especially the land use (Tab. 4 and Fig. 7). On the other hand, the cartographic comparison shows that the classes which, according to the statistical results of the landslide affected area (Tab. 1), are supposed to reduce the susceptibility to landslides, reduce it more in the GMM map than in the FR map (e.g., brushwood, olive trees and orchards, badlands) even in a detailed scale, despite the relative monotony of these classes at a broad scale. This confirms that the GMM model gives more liberative results.
This type of map constitutes an essential database to guide urban planning and food production plans in the region. However, the use of these data must seriously consider the influencing parameters identified in this study. Thus, in areas with high susceptibility levels, the risk mitigation could be well oriented and effective while saving time and costs. Furthermore, the models can trustfully be applied in other regions with similar geomorphological and geological contexts, especially in the Pre-Rif region.
Based on the results of these two accurate and practical methods, the future research could be directed towards improving the accuracy of these models by testing different combination of influencing parameters and comparing the results at a regional scale. This method will allow to find the most effective combination for accurate susceptibility results and then, be reliably applied in similar regional contexts.
List of acronyms
MY: Moulay Yacoub
LIM: Landslide inventory map
GMM: GIS Matrix method
FR: Frequency Ratio
LS: Landslide susceptibility
LSM: Landslide susceptibility map
TWI: Topographic wetness index
G-K: Good-man-Krustal
EFF: Effective
NEF: Non-effective
LSI: Landslide susceptibility index
FAD: Frequency Area Distribution
DP: Double Paretto
ING: Three Parameter Inverse Gamma
DF: Degree of fit
AUC: Area under the curve
MPI: Measures of the parameter importance
Supplementary Material
Fig. A.1: Landslide influencing parameters in the study area. TWI: Topographic wetness index.
Fig. B.1: Image board showing earthflows and their flow-like/ductile appearance in the study area; a field mission photo where the earth flow was concealed by cereal farming; b, c, and d earth flows mapped on google earth 2018’s image.
Fig. C.1: Landslides in olive areas a. deep and slow landslide damaging the road section b. Large and eroded landslides reactivated down the slope c. active slide (on right) and flow (on left) affecting olive growing slopes d. and e. recent and active landslide affecting brush area.
Access Supplementary MaterialReferences
- Abdulwahid WM, Pradhan B. 2017. Landslide vulnerability and risk assessment for multi-hazard scenarios using airborne laser scanning data (LiDAR). Landslides 14: 1057–1076. [CrossRef] [Google Scholar]
- Aditian, A., Kubota, T., & Shinohara, Y. (2018). Comparison of GIS-based landslide susceptibility models using frequency ratio, logistic regression, and artificial neural network in a tertiary region of Ambon, Indonesia. Geomorphology, 318: 101–111. [Google Scholar]
- Agharroud K, Siame LL, Ben Moussa A, et al. 2021. Seismo-tectonic model for the southern pre-rif border (northern morocco): insights from morphochronology. Tectonics 40: https://doi.org/10.1029/2020TC006633 [CrossRef] [Google Scholar]
- Akgun A. 2012. A comparison of landslide susceptibility maps produced by logistic regression, multi-criteria decision, and likelihood ratio methods: a case study at İzmir, Turkey. Landslides 9: 93–106. [CrossRef] [Google Scholar]
- Antonini G, Ardizzone F, Cardinali M, et al. 2002. Surface deposits and landslide inventory map of the area affected by the 1997 Umbria-Marche earthquakes. Boll della Soc Geol Ital 121: 843–853. [Google Scholar]
- Ayalew L, Yamagishi H, Ugawa N. 2004. Landslide susceptibility mapping using GIS-based weighted linear combination, the case in Tsugawa area of Agano River, Niigata Prefecture, Japan. Landslides 1: 73–81. [CrossRef] [Google Scholar]
- Bălteanu D, Micu M, Jurchescu M, et al. 2020. National-scale landslide susceptibility map of Romania in a European methodological framework. Geomorphology 371: 107432. [CrossRef] [Google Scholar]
- Bao Y, Zhai S, Chen J, et al. 2020. The evolution of the Samaoding paleolandslide river blocking event at the upstream reaches of the Jinsha River, Tibetan Plateau. Geomorphology 351: 106970. [CrossRef] [Google Scholar]
- Bardi F, Raspini F, Frodella W, et al. 2017. Monitoring the rapid-moving reactivation of earth flows by means of GB-InSAR: The April 2013 Capriglio Landslide (Northern Appennines, Italy). Remote Sens 9: 165. [CrossRef] [Google Scholar]
- Bargach K, Ruano P, Chabli A, et al. 2004. Recent tectonic deformations and stresses in the frontal part of the Rif Cordillera and the Saïss Basin (Fes and Rabat regions, Morocco). Pure Appl Geophys 161: 521–540. [CrossRef] [Google Scholar]
- Beguería S. 2006. Changes in land cover and shallow landslide activity: a case study in the Spanish Pyrenees. Geomorphology 74: 196–206. [CrossRef] [Google Scholar]
- Belle P, Aunay B, Lachassagne P, et al. 2018. Control of tropical landcover and soil properties on landslides’ aquifer recharge, piezometry and dynamics. Water 10: 1491. [CrossRef] [Google Scholar]
- Boualla O, Mehdi K, Fadili A, et al. 2019. GIS-based landslide susceptibility mapping in the Safi region, West Morocco. Bull Eng Geol Environ 78: 2009–2026. https://doi.org/10.1007/s10064-017-1217-y [CrossRef] [Google Scholar]
- Bounab A, Agharroud K, El Kharim Y, et al. 2022. The importance of investigating causative factors and training data selection for accurate landslide susceptibility assessment: the case of Ain Lahcen commune (Tetouan, Northern : Geocarto International 37, 25 (2022): 9967–9997. https://doi.org/10.1080/10106049.2022.2028905 [Google Scholar]
- Bourenane H, Bouhadad Y, Guettouche MS, Braham M. 2015. GIS-based landslide susceptibility zonation using bivariate statistical and expert approaches in the city of Constantine (Northeast Algeria). Bull Eng Geol Environ 74: 337–355. [CrossRef] [Google Scholar]
- Brunetti MT, Guzzetti F, Cardinali M, et al. 2014. Analysis of a new geomorphological inventory of landslides in Valles Marineris, Mars. Earth Planet Sci Lett 405: 156–168. https://doi.org/10.1016/J.EPSL.2014.08.025 [CrossRef] [Google Scholar]
- Burbank DW. 2002. Rates of erosion and their implications for exhumation. Mineral Mag 66: 25–52. [CrossRef] [Google Scholar]
- Byou T, Obda K, Taous A, Obda I. 2020. Susceptibilité aux glissements de terrain dans la ville d’Al Hoceima et sa périphérie: application de la méthode de la théorie de l’évidence. Geomatica 75: 1–27. https://doi.org/10.1139/geomat-2019-0025 [CrossRef] [Google Scholar]
- Cao Y, Wei X, Fan W, et al. 2021. Landslide susceptibility assessment using the weight of evidence method: a case study in Xunyang area, China. PLoS One 16: e0245668. [Google Scholar]
- Cardinali M, Antonini G, Reichenbach P, Guzzetti F. 2001. Photo geological and landslide inventory map for the Upper Tiber River basin. CNR, Grup Naz per la Dif dalle Catastr Idrogeol Publ. [Google Scholar]
- Catani F, Casagli N, Ermini L, et al. 2005. Landslide hazard and risk mapping at catchment scale in the Arno River basin. Landslides 2: 329–342. [CrossRef] [Google Scholar]
- Chabok M, Bahrami H, Asakereh A, Jaafarzadeh NA. 2019. Landfills site selection in southern cities of Khuzestan province with using fuzzy set and AHP method. J Adv Appl Geol 9: 142–155. [Google Scholar]
- Chacón J, Irigaray C, Fernandez T, El Hamdouni R. 2006. Engineering geology maps: landslides and geographical information systems. Bull Eng Geol Environ 65: 341–411. [CrossRef] [Google Scholar]
- Chalouan A, Gil AJ, Galindo-Zaldívar J, et al. 2014. Active faulting in the frontal Rif Cordillera (Fes region, Morocco): constraints from GPS data. J Geodyn 77: 110–122. [CrossRef] [Google Scholar]
- Charroud M, Cherai B, Benabdelhadi M, Falguères C. 2007. Impact de la néotectonique quaternaire sur la dynamique sédimentaire du Saïs (Maroc): du bassin d’avant fosse pliocène au plateau continental quaternaire. Quat Rev l’Association française pour l’étude du Quat 18: 327–334. [Google Scholar]
- Chaudhary P, Chhetri SK, Joshi KM, et al. 2016. Application of an Analytic Hierarchy Process (AHP) in the GIS interface for suitable fire site selection: a case study from Kathmandu Metropolitan City, Nepal. Socioecon Plann Sci 53: 60–71. [CrossRef] [Google Scholar]
- Chung C-JF, Fabbri AG. 1999. Probabilistic prediction models for landslide hazard mapping. Photogramm Eng Remote Sensing 65: 1389–1399. [Google Scholar]
- Chung C-JF, Fabbri AG. 2003. Validation of spatial prediction models for landslide hazard mapping. Nat Hazards 30: 451–472. [CrossRef] [Google Scholar]
- Chung CF, Fabbri AG. 2005. Systematic procedures of landslide hazard mapping for risk assessment using spatial prediction models. Landslide hazard risk 139–174. [CrossRef] [Google Scholar]
- Conforti M, Pascale S, Robustelli G, Sdao F. 2014. Evaluation of prediction capability of the artificial neural networks for mapping landslide susceptibility in the Turbolo River catchment (northern Calabria, Italy). Catena 113: 236–250. [CrossRef] [Google Scholar]
- Corominas J, Moya J. 2008. A review of assessing landslide frequency for hazard zoning purposes. Eng Geol 102: 193–213. [CrossRef] [Google Scholar]
- Costanzo D, Rotigliano E, Irigaray C, et al. 2012. Factors selection in landslide susceptibility modelling on large scale following the gis matrix method: application to the river Beiro basin (Spain). Nat Hazards Earth Syst Sci 12: 327–340. [CrossRef] [Google Scholar]
- Crozier MJ. 1984. Field assessment of slope instability. Slope Instab 103–142. [Google Scholar]
- Davis JC. 1973. Statistics and data analysis in geology. New York: John Wiley. [Google Scholar]
- DeGRAFF JV. 1985. Using isopleth maps of landslide deposits as a tool in timber sale planning. Bull Assoc Eng Geol 22: 445–453. [Google Scholar]
- Del Soldato M, Bianchini S, Calcaterra D, et al. 2017. A new approach for landslide-induced damage assessment. Geomatics, Nat Hazards Risk 8: 1524–1537. [Google Scholar]
- Demir G, Aytekin M, Akgün A, et al. 2013. A comparison of landslide susceptibility mapping of the eastern part of the North Anatolian Fault Zone (Turkey) by likelihood-frequency ratio and analytic hierarchy process methods. Nat Hazards 65: 1481–1506. [CrossRef] [Google Scholar]
- DGM Direction Générale de la Météorologie. Fez-Boulemane [Google Scholar]
- Donati L, Turrini MC. 2002. An objective method to rank the importance of the factors predisposing to landslides with the GIS methodology: application to an area of the Apennines (Valnerina; Perugia, Italy). Eng Geol 63: 277–289. [CrossRef] [Google Scholar]
- El Kharim Y, Bounab A, Ilias O, et al. 2021. Landslides in the urban and suburban perimeter of Chefchaouen (Rif, Northern Morocco): inventory and case study. Nat Hazards 107: 355–373. [CrossRef] [Google Scholar]
- Feizizadeh B, Blaschke T. 2013. GIS-multicriteria decision analysis for landslide susceptibility mapping: comparing three methods for the Urmia lake basin, Iran. Nat Hazards 65: 2105–2128. [CrossRef] [Google Scholar]
- Feizizadeh B, Jankowski P, Blaschke T. 2014. A GIS based spatially-explicit sensitivity and uncertainty analysis approach for multi-criteria decision analysis. Comput Geosci 64: 81–95. [CrossRef] [Google Scholar]
- Fell R, Corominas J, Bonnard C, et al. 2008. Guidelines for landslide susceptibility, hazard and risk zoning for land-use planning. Eng Geol 102: 99–111. [CrossRef] [Google Scholar]
- Fernández T, Irigaray C, El Hamdouni R, Chacón J. 2003. Methodology for landslide susceptibility mapping by means of a GIS. Application to the Contraviesa Area (Granada, Spain) [Google Scholar]
- Fu S, Chen L, Woldai T, et al. 2020. Landslide hazard probability and risk assessment at the community level: a case of western Hubei, China. Nat Hazards Earth Syst Sci 20: 581–601. [CrossRef] [Google Scholar]
- Gaidzik K, Ramírez-Herrera MT. 2021. The importance of input data on landslide susceptibility mapping. Sci Rep 11: 1–14. [CrossRef] [PubMed] [Google Scholar]
- Galli M, Ardizzone F, Cardinali M, et al. 2008. Comparing landslide inventory maps. Geomorphology 94: 268–289. https://doi.org/10.1016/J.GEOMORPH.2006.09.023 [CrossRef] [Google Scholar]
- Garcia-Chevesich P, Wei X, Ticona J, et al. 2021. The impact of agricultural irrigation on landslide triggering: a review from chinese, english, and Spanish literature. Water (Switzerland) 13. [Google Scholar]
- García-Ruiz JM, Beguería S, Alatorre LC, Puigdefábregas J. 2010. Land cover changes and shallow landsliding in the flysch sector of the Spanish Pyrenees. Geomorphology 124: 250–259. [CrossRef] [Google Scholar]
- Goodchild MF. 1986. Spatial autocorrelation. Geo Books. [Google Scholar]
- Goodman LA, Kruskal WH. 1979. Measures of association for cross classifications. Meas Assoc cross Classif 2–34. [Google Scholar]
- Guns M, Vanacker V. 2013. Forest cover change trajectories and their impact on landslide occurrence in the tropical Andes. Environ Earth Sci 70: 2941–2952. https://doi.org/10.1007/s12665-013-2352-9 [CrossRef] [Google Scholar]
- Guns M, Vanacker V. 2014. Shifts in landslide frequency-area distribution after forest conversion in the tropical Andes. Anthropocene 6: 75–85. https://doi.org/10.1016/J.ANCENE2014.08.001 [CrossRef] [Google Scholar]
- Guzzetti F, Cardinali M, Reichenbach P, Carrara A. 2000. Comparing landslide maps: a case study in the Upper Tiber River Basin, Central Italy. Environ Manage 25: [Google Scholar]
- Guzzetti F, Galli M, Reichenbach P, et al. 2006. Landslide hazard assessment in the Collazzone area, Umbria, Central Italy. Nat Hazards Earth Syst Sci 6: 115–131. [CrossRef] [Google Scholar]
- Guzzetti F, Malamud BD, Turcotte DL, Reichenbach P. 2002. Power-law correlations of landslide areas in central Italy. Earth Planet Sci Lett 195: 169–183. https://doi.org/10.1016/S0012-821X(01)00589-1 [CrossRef] [Google Scholar]
- Guzzetti F, Reichenbach P, Cardinali M, et al. 2005. Probabilistic landslide hazard assessment at the basin scale. Geomorphology 72: 272–299. [CrossRef] [Google Scholar]
- Hansen A. 1984. Landslide hazard analysis. Slope Instab 523–602. [Google Scholar]
- Harmouzi H, Nefeslioglu HA, Rouai M, et al. 2019. Landslide susceptibility mapping of the Mediterranean coastal zone of Morocco between Oued Laou and El Jebha using artificial neural networks (ANN). Arab J Geosci 12:. https://doi.org/10.1007/s12517-019-4892-0 [CrossRef] [Google Scholar]
- Hasekioğulları GD, Ercanoglu M. 2012. A new approach to use AHP in landslide susceptibility mapping: a case study at Yenice (Karabuk, NW Turkey). Nat Hazards 63: 1157–1179. [CrossRef] [Google Scholar]
- Hassan T, Benoît D, Abdel-Ali C, et al. 2015. Neotectonic and mass movements on the new Fez-Taza highway (Northern Morocco). In: Engineering Geology for Society and Territory-Volume 6. Springer, pp. 95–99. [CrossRef] [Google Scholar]
- Heusch B. 1970. L’érosion du pré-Rif. Une étude quantitative de l’érosion hydraulique dans les collines marneuses du pré-Rif occidental. [Google Scholar]
- Hölbling D, Friedl B, Eisank C. 2015. An object-based approach for semi-automated landslide change detection and attribution of changes to landslide classes in northern Taiwan. Earth Sci Informatics 8: 327–335. [CrossRef] [Google Scholar]
- Holec J, Bednarik M, Šabo M, et al. 2013. A small-scale landslide susceptibility assessment for the territory of Western Carpathians. Nat Hazards 69: 1081–1107. [CrossRef] [Google Scholar]
- Hong H, Chen W, Xu C, et al. 2017. Rainfall-induced landslide susceptibility assessment at the Chongren area (China) using frequency ratio, certainty factor, and index of entropy. Geocarto Int 32: 139–154. [Google Scholar]
- Hovius N, Stark CP, Allen PA. 1997. Sediment flux from a mountain belt derived by landslide mapping. Geology 25: 231–234. [CrossRef] [Google Scholar]
- Hovius N, Stark CP, Hao-Tsu C, Jiun-Chuan L. 2000. Supply and removal of sediment in a landslide-dominated mountain belt: central range, Taiwan. J Geol 108: 73–89. [CrossRef] [Google Scholar]
- Howard AD. 2009. Badlands and gullying. In: Geomorphology of desert environments. Springer, pp. 265–299. [CrossRef] [Google Scholar]
- Huang F, Yao C, Liu W, et al. 2018. Landslide susceptibility assessment in the Nantian area of China: a comparison of frequency ratio model and support vector machine. Geomatics, Nat Hazards Risk 9: 919–938. [CrossRef] [Google Scholar]
- Hungr O, Leroueil S, Picarelli L. 2014. The Varnes classification of landslide types, an update. Landslides 11: 167–194. [CrossRef] [Google Scholar]
- Irigaray C. 1995. Movimientos de ladera: inventario, análisis y cartografía de susceptibilidad mediante un sistema de información geográfica (SIG). Aplicación a las zonas de Colmenar (Ma), Rute (Co) y Montefrío (Gr). [Google Scholar]
- Irigaray C, Fernández T, El Hamdouni R, Chacón J. 2007. Evaluation and validation of landslide-susceptibility maps obtained by a GIS matrix method: examples from the Betic Cordillera (Southern Spain). Nat Hazards 41: 61–79. https://doi.org/10.1007/s11069-006-9027-8 [CrossRef] [Google Scholar]
- Jiménez-Perálvarez JD, Irigaray C, El Hamdouni R, Chacón J. 2009. Building models for automatic landslide-susceptibility analysis, mapping and validation in ArcGIS. Natural Hazards 571–590. [CrossRef] [Google Scholar]
- Kannan M, Saranathan E, Anabalagan R. 2013. Landslide vulnerability mapping using frequency ratio model: a geospatial approach in Bodi-Bodimettu Ghat section, Theni district, Tamil Nadu, India. Arab J Geosci 6: 2901–2913. [CrossRef] [Google Scholar]
- Kavzoglu T, Sahin EK, Colkesen I. 2014. Landslide susceptibility mapping using GIS-based multi-criteria decision analysis, support vector machines, and logistic regression. Landslides 11: 425–439. [CrossRef] [Google Scholar]
- Kavzoglu, T., Kutlug Sahin, E., & Colkesen, I. (2015). An assessment of multivariate and bivariate approaches in landslide susceptibility mapping: a case study of Duzkoy district. Natural Hazards, 76: 471–496. [Google Scholar]
- Komac M. 2006. A landslide susceptibility model using the analytical hierarchy process method and multivariate statistics in perialpine Slovenia. Geomorphology 74: 17–28. [CrossRef] [Google Scholar]
- Korup O, Densmore AL, Schlunegger F. 2010. The role of landslides in mountain range evolution. Geomorphology 120: 77–90. [CrossRef] [Google Scholar]
- Krivoguz D, Bespalova L. 2017. Spatial analysis of topography of Kerch peninsula using GIS and its impact on landslides. Int J Prof Sci 19–32. [Google Scholar]
- Lakhdar A, Ntarmouchant A, Ribeiro ML, et al. 2006. Nouvelle approche géologique et géodinamique du Complexe Hydrothermal de Moulay Yacoub, bordure septentrionale du Sillon Sud Rifain. [Google Scholar]
- Lazzari M, Danese M, Gioia D. 2012. The contribution of fluvial and mass wasting processes to sedimentary budget in mountain catchments of the southern Apennines, Italy. In: EGU General Assembly Conference Abstracts. p. 10740. [Google Scholar]
- Lee S, Choi J. 2004. Landslide susceptibility mapping using GIS and the weight-of-evidence model. Int J Geogr Inf Sci 18: 789–814. [CrossRef] [Google Scholar]
- Lee S, Sambath T. 2006. Landslide susceptibility mapping in the Damrei Romel area, Cambodia using frequency ratio and logistic regression models. Environ Geol 50: 847–855. https://doi.org/10.1007/s00254-006-0256-7 [CrossRef] [Google Scholar]
- Li L, Lan H, Guo C, et al. 2017. A modified frequency ratio method for landslide susceptibility assessment. Landslides 14: 727–741. https://doi.org/10.1007/s10346-016-0771-x [CrossRef] [Google Scholar]
- Li L, Lan H, Wu Y. 2016. How sample size can effect landslide size distribution. Geoenvironmental Disasters 3: 1–11. https://doi.org/10.1186/S40677-016-0052-Y/FIGURES/7 [CrossRef] [Google Scholar]
- Malamud BD, Turcotte DL, Guzzetti F, Reichenbach P. 2004. Landslide inventories and their statistical properties. Earth Surf Process Landforms 29: 687–711. https://doi.org/10.1002/ESP1064 [CrossRef] [Google Scholar]
- Marino P, Peres DJ, Cancelliere A, et al. 2020. Soil moisture information can improve shallow landslide forecasting using the hydrometeorological threshold approach. Landslides 17: 2041–2054. [CrossRef] [Google Scholar]
- Mastere M, Van Vliet-Lanoë B, Brahim LA. 2013. Cartographie de l’occupation des sols en relation avec les mouvements gravitaires et le ravinement dans le Rif nord-occidental (Maroc). Géomorphologie Reli Process Environ 19: 335–352. [CrossRef] [Google Scholar]
- Mind’je R, Li L, Nsengiyumva JB, et al. 2020. Landslide susceptibility and influencing factors analysis in Rwanda. Environ Dev Sustain 22: 7985–8012. [CrossRef] [Google Scholar]
- Monsieurs E, Dewitte O, Demoulin A. 2019. A susceptibility-based rainfall threshold approach for landslide occurrence. Nat Hazards Earth Syst Sci 19: 775–789. [CrossRef] [Google Scholar]
- Neuhäuser B, Damm B, Terhorst B. 2012. GIS-based assessment of landslide susceptibility on the base of the weights-of-evidence model. Landslides 9: 511–528. [CrossRef] [Google Scholar]
- Notti D, Galve JP, Mateos RM, et al. 2015. Human-induced coastal landslide reactivation. Monitoring by PSInSAR techniques and urban damage survey (SE Spain). Landslides 12:. https://doi.org/10.1007/s10346-015-0612-3 [CrossRef] [Google Scholar]
- Obda I, El Kharim Y, Bounab A, et al. 2022. Multi-criteria assessment approach of slow-moving urban landslide hazard: the case of Moulay Yacoub, Morocco. Can J Earth Sci 99: 1–18. [Google Scholar]
- Obda I, El Kharim Y, Bounab A, et al. 2021. Multi criteria assessing approach of the slow-moving urban landslide hazard, the case of Moulay Yacoub town (Morocco). Can J Earth Sci. [Google Scholar]
- Osna T, Sezer EA, Akgun A. 2014. GeoFIS: an integrated tool for the assessment of landslide susceptibility. Comput Geosci 66: 20–30. [CrossRef] [Google Scholar]
- Othman, A. A., Gloaguen, R., Andreani, L., & Rahnama, M. (2015). Landslide susceptibility mapping in Mawat area, Kurdistan Region, NE Iraq: a comparison of different statistical models. Natural Hazards and Earth System Sciences Discussions, 3: 1789–1833. [Google Scholar]
- Pantelidis L. 2011. An innovative landslide risk assessment system: application to highway embankments. In: Geo-Risk 2011: Risk Assessment and Management. pp. 1012–1019. [Google Scholar]
- Park S, Choi C, Kim B, Kim J. 2013. Landslide susceptibility mapping using frequency ratio, analytic hierarchy process, logistic regression, and artificial neural network methods at the Inje area, Korea. Environ Earth Sci 68: 1443–1464. [CrossRef] [Google Scholar]
- Pereira S, Zêzere JL, Bateira C. 2012. Technical note: assessing predictive capacity and conditional independence of landslide predisposing factors for shallow landslide susceptibility models. Nat Hazards Earth Syst Sci 12: 979–988. https://doi.org/10.5194/nhess-12-979-2012 [CrossRef] [Google Scholar]
- Petley DN, Dunning SA, Rosser NJ. 2005. The analysis of global landslide risk through the creation of a database of worldwide landslide fatalities. In: Landslide risk management. CRC Press, pp. 377-384. [Google Scholar]
- Picarelli L, Urciuoli G, Ramondini M, Comegna L. 2005. Main features of mudslides in tectonised highly fissured clay shales. Landslides 2: 15–30. [CrossRef] [Google Scholar]
- Poujol A, Ritz J-F, Vernant P, et al. 2017. Which fault destroyed Fes city (Morocco) in 1755? A new insight from the Holocene deformations observed along the southern border of Gibraltar arc. Tectonophysics 712: 303–311. [CrossRef] [Google Scholar]
- Pourghasemi HR, Pradhan B, Gokceoglu C. 2012. Application of fuzzy logic and analytical hierarchy process (AHP) to landslide susceptibility mapping at Haraz watershed, Iran. Nat Hazards 63: 965–996. [CrossRef] [Google Scholar]
- Pourghasemi HR, Rahmati O. 2018. Prediction of the landslide susceptibility: which algorithm, which precision? Catena 162: 177–192. [CrossRef] [Google Scholar]
- Pourghasemi HR, Yansari ZT, Panagos P, Pradhan B. 2018. Analysis and evaluation of landslide susceptibility: a review on articles published during 2005–2016 (periods of 2005–2012 and 2013-2016). Arab J Geosci 11: 1–12. [CrossRef] [Google Scholar]
- Kavzoglu, T., Kutlug Sahin, E., & Colkesen, I. (2015). An assessment of multivariate and bivariate approaches in landslide susceptibility mapping: a case study of Duzkoy district. Natural Hazards, 76, 471-496. [Google Scholar]
- Qin C-Z., Zhu A-X., Pei T, et al. 2011. An approach to computing topographic wetness index based on maximum downslope gradient. Precis Agric 12: 32–43. [CrossRef] [Google Scholar]
- Qiu H, Hu S, Yang D, et al. 2020. Comparing landslide size probability distribution at the landscape scale (Loess Plateau and the Qinba Mountains, Central China) using double Pareto and inverse gamma. Bull Eng Geol Environ. https://doi.org/10.1007/s10064-020-02037-w [Google Scholar]
- Razavizadeh S, Solaimani K, Massironi M, Kavian A. 2017. Mapping landslide susceptibility with frequency ratio, statistical index, and weights of evidence models: a case study in northern Iran. Environ Earth Sci 76: 1–16. [CrossRef] [Google Scholar]
- RGPH. 2014. Morocco population and housing census, high commission for planning. [Google Scholar]
- Roering JJ, Schmidt KM, Stock JD, et al. 2003. Shallow landsliding, root reinforcement, and the spatial distribution of trees in the Oregon Coast Range. Can Geotech J 40: 237–253. [CrossRef] [Google Scholar]
- Rogers NW, Selby MJ. 1980. Mechanisms of shallow translational landsliding during summer rainstorms: North Island, New Zealand. Geogr Ann Ser A, Phys Geogr 62: 11–21. [Google Scholar]
- Rouai M, Jaaidi EB. 2003. Scaling properties of landslides in the Rif mountains of Morocco. Eng Geol 68: 353–359. [CrossRef] [Google Scholar]
- Rybar J, Stemberk J, Wagner P. 2002. Landslides: Proceedings of the First European Conference on Landslides, Prague, Czech Republic, 24–26 June 2002. CRC Press. [Google Scholar]
- Sahrane R, Ali B, El Kharim Y. Investigating the effects of landslides inventory completeness on susceptibility mapping and frequency-area distributions: case of Taounate Province, Northern Morocco. North Morocco. [Google Scholar]
- Sahrane R, El Kharim Y, Bounab A. 2022. Investigating the effects of landscape characteristics on landslide susceptibility and Frequency-area distributions: the case of Taounate province, Northern Morocco. Geocarto Int 1–22. [Google Scholar]
- Schicker, R., & Moon, V. (2012). Comparison of bivariate and multivariate statistical approaches in landslide susceptibility mapping at a regional scale. Geomorphology, 161: 40–57. [Google Scholar]
- Schuster RL. 1996. Socioeconomic significance of landslides. Landslides Investig Mitigation Washingt Natl Acad Press Transp Res Board Spec Rep 247: 12–35. [Google Scholar]
- Schuster RL, Highland L. 2001. Socioeconomic and environmental impacts of landslides in the western hemisphere. Citeseer. [Google Scholar]
- Schuster RL, Varnes DJ, Savage WZ. 1996. The Slumgullion earth flow: a large-scale natural laboratory. US Geol Surv Bull 2130: [Google Scholar]
- Schwarz M, Lehmann P, Or D. 2010. Quantifying lateral root reinforcement in steep slopes-from a bundle of roots to tree stands. Earth Surf Process Landforms J Br Geomorphol Res Gr 35: 354–367. [CrossRef] [Google Scholar]
- Sendide O. 2002. Etude qualitative des eaux de la nappe phréatique du bassin de Fès-Meknés, caractérisation, évaluation, modélisation mathématique et moyen de protection. [Google Scholar]
- Sidle R, Ochiai H. 2006. Processes, prediction, and land use. Water Resour Monogr Am Geophys Union, Washingt. [Google Scholar]
- Soeters R, Van Westen CJ. 1996. Slope instability recognition, analysis and zonation. Landslides Investig Mitig 247: 129–177. [Google Scholar]
- Sun D, Xu J, Wen H, Wang D. 2021. Assessment of landslide susceptibility mapping based on Bayesian hyperparameter optimization: a comparison between logistic regression and random forest. Eng Geol 281:. https://doi.org/10.1016/j.enggeo.2020.105972 [Google Scholar]
- Sun X, Chen J, Bao Y, et al. 2018. Landslide susceptibility mapping using logistic regression analysis along the Jinsha river and its tributaries close to Derong and Deqin County, southwestern China. ISPRS Int J Geo-Information 7: 438. [CrossRef] [Google Scholar]
- Süzen, M. L., & Doyuran, V. (2004). A comparison of the GIS based landslide susceptibility assessment methods: multivariate versus bivariate. Environmental geology, 45: 665–679. [Google Scholar]
- Swets JA. 1988. Measuring the accuracy of diagnostic systems. Science (80-) 240: 1285–1293. [CrossRef] [PubMed] [Google Scholar]
- Tanyaş H, van Westen CJ, Allstadt KE, Jibson RW. 2019. Factors controlling landslide frequency-area distributions. Earth Surf Process Landforms 44: 900–917. https://doi.org/10.1002/ESP4543 [CrossRef] [Google Scholar]
- Thiery Y, Malet J-P., Sterlacchini S, et al. 2007. Landslide susceptibility assessment by bivariate methods at large scales: application to a complex mountainous environment. Geomorphology 92: 38–59. [CrossRef] [Google Scholar]
- Tien Bui D, et al. 2019. New ensemble models for shallow landslide susceptibility modeling in a semi-arid watershed. Forests 10: 743. [CrossRef] [Google Scholar]
- Tribak A. 1997. Quelques exemples de mouvements de terrain dans le Prérif oriental (Maroc). Méditerranée 86: 61–66. [Google Scholar]
- Tribak A, El Garouani A, Abahrour M. 2009. Evaluation quantitative de l’érosion hydrique sur les terrains marneux du PréRif oriental (Maroc): cas du sous-bassin de l’oued Tlata. Sci Chang Planétaires/Sécheresse 20: 333–337. [Google Scholar]
- Vakhshoori V, Zare M. 2016. Landslide susceptibility mapping by comparing weight of evidence, fuzzy logic, and frequency ratio methods. Geomatics, Nat Hazards Risk 7: 1731–1752. [Google Scholar]
- van Beek LPH. 2002. Assessment of the influence of changes in land use and climate on landslide activity in a Mediterranean environment. [Google Scholar]
- Van Den Eeckhaut M, Poesen J, Govers G, et al. 2007. Characteristics of the size distribution of recent and historical landslides in a populated hilly region. Earth Planet Sci Lett 256: 588–603. [CrossRef] [Google Scholar]
- Van Den Eeckhaut F M, Poesen J, Verstraeten G, et al. 2005. The effectiveness of hillshade maps and expert knowledge in mapping old deep-seated landslides. Geomorphology 67: 351–363. [CrossRef] [Google Scholar]
- Van Den Eeckhaut, M., Poesen, J., Govers, G., Verstraeten, G., & Demoulin, A. (2007). Characteristics of the size distribution of recent and historical landslides in a populated hilly region. Earth and Planetary Science Letters, 256: 588–603. [Google Scholar]
- Van Den Eeckhaut, M., Marre, A., & Poesen, J. (2010). Comparison of two landslide susceptibility assessments in the Champagne–Ardenne region (France). Geomorphology, 115: 141–155. [Google Scholar]
- Vanwalleghem T, Van Den Eeckhaut F M, Poesen J, et al. 2008. Spatial analysis of factors controlling the presence of closed depressions and gullies under forest: application of rare event logistic regression. Geomorphology 95: 504–517. [CrossRef] [Google Scholar]
- Varnes DJ, Cruden DM. 1996. Landslide types and processes. Landslides Investig mitigation, Transp Res Board Spec Rep 247: [Google Scholar]
- Wang W-D., Guo J, Fang L-G., Chang X-S. 2012. A subjective and objective integrated weighting method for landslides susceptibility mapping based on GIS. Environ Earth Sci 65: 1705–1714. [CrossRef] [Google Scholar]
- WBG. 2021. Climate risk country profile (Morocco). [Google Scholar]
- Winckel A. 2002. Etablissement d’une typologie des eaux thermales par une approche hydrochimique, isotopique et tectonique: exemple du Maroc. [Google Scholar]
- Yalcin A, Reis S, Aydinoglu AC, Yomralioglu T. 2011. A GIS-based comparative study of frequency ratio, analytical hierarchy process, bivariate statistics and logistics regression methods for landslide susceptibility mapping in Trabzon, NE Turkey. Catena 85: 274–287. [CrossRef] [Google Scholar]
- Youssef AM, Al-Kathery M, Pradhan B. 2015. Landslide susceptibility mapping at Al-Hasher area, Jizan (Saudi Arabia) using GIS-based frequency ratio and index of entropy models. Geosci J 19: 113–134. https://doi.org/10.1007/s12303-014-0032-8 [CrossRef] [Google Scholar]
- Zêzere JL, Pereira S, Melo R, et al. 2017. Mapping landslide susceptibility using data-driven methods. Sci Total Environ 589: 250–267. [CrossRef] [Google Scholar]
- Zhang Y xing, Lan H xing, Li L ping et al. 2020. Optimizing the frequency ratio method for landslide susceptibility assessment: a case study of the Caiyuan Basin in the southeast mountainous area of China. J Mt Sci 17: 340–357. https://doi.org/10.1007/s11629-019-5702-6 [CrossRef] [Google Scholar]
- Zhou C, Yin K, Cao Y, et al. 2018. Landslide susceptibility modeling applying machine learning methods: a case study from Longju in the Three Gorges Reservoir area, China. Comput Geosci 112: 23–37. [CrossRef] [Google Scholar]
- Zhou S, Chen G, Fang L, Nie Y. 2016. GIS-based integration of subjective and objective weighting methods for regional landslides susceptibility mapping. Sustainability 8: 334. [CrossRef] [Google Scholar]
- Zieher T, Perzl F, Rössel M, et al. 2016. A multi-annual landslide inventory for the assessment of shallow landslide susceptibility-two test cases in Vorarlberg, Austria. Geomorphology 259: 40–54. [CrossRef] [Google Scholar]
Cite this article as: I. Obda, O. Obda, R. Sahran, Y. El Kharim, A. Lahrach, M. Ahniche. 2024. Landslide susceptibility mapping using GIS Matrix Method and Frequency Ratio, application in the marly context of Moulay Yacoub Region, Morocco, BSGF - Earth Sciences Bulletin 195: 1.
All Tables
Sample of the landslide-susceptibility matrix considering all the slope movements in the study area: Cm: combine number whose line shows the numbers of each class factor, Lith: lithology, Ele: elevation, Ds-ri: distance from river, Lu: land use, Sl: slope, Ds-ro: distance from roads, Twi, topographic wetness index, Rgh: slope roughness, LSM%: percentage of landslide susceptibility matrix, LS: landslide susceptibility.
Contingency tables showing the total surface (class pixels) and its percentage (% Class pixels), the affected surface by landslides (L. pixels) and the percentage of the latter (% L. pixels) of each class factor; The main factors classes which are strongly affected are underlined.
G-k and R values showing the correlation degree of the pre-selected conditioning factors with landslide types; R: Pearson R coefficient, G-K: Goodman and Kruskal coefficient.
Covering area for each landslide susceptibility class presented by the FR (left) and GMM (right) maps.
All Figures
|
Fig. 1 a Geological map of northwest Morocco: (CQ) continental quaternary, (NSR) Neogene South-Rifan corridor, (NV) Neogene volcanism, (PR) Prérif, (MR) Mesorif, (INR) Intrarif, (F) flysch unit, (IR) Internal Rif, (M) Mesozoic blanket, (CM) Caledonian western Meseta, (TF) Frontal thrust; b Lithological map of the MY province. |
| In the text | |
|
Fig. 2 a. Key characteristics of the landslide database. a. landslide inventory map; b. occurrences of earth flows by area of the movements; c. occurrences of slide by area of movements; d. Double Pareto, and Inverse Gamma models with frequency area distribution of the landslide inventory. |
| In the text | |
|
Fig. 3 Landslide influencing parameters in the study area. |
| In the text | |
|
Fig. 4 Histograms reveal the landslide occurrences by slope ranges (panel a), land use sub-classes (panel b) and by material involved (c). |
| In the text | |
|
Fig. 5 a shows the abundant active shallow landslides affecting several cereal farming slopes. |
| In the text | |
|
Fig. 6 Double Pareto, Inverse Gamma and frequency area distribution of landslide inventory in cereal farming and olive trees slopes. |
| In the text | |
|
Fig. 7 Landslide susceptibility maps with the location of movements used for validation, a GIS Matrix Method map, b Frequency Ratio map. |
| In the text | |
|
Fig. 8 Noticeable impact of land use sub-classes in mitigating landslide susceptibility level of both maps FR and GMM; a effect of brushwood, b effect of orchards, c effect of Badlands and brushwood, d location of the zooms a,b and c in the land use map. |
| In the text | |
Current usage metrics show cumulative count of Article Views (full-text article views including HTML views, PDF and ePub downloads, according to the available data) and Abstracts Views on Vision4Press platform.
Data correspond to usage on the plateform after 2015. The current usage metrics is available 48-96 hours after online publication and is updated daily on week days.
Initial download of the metrics may take a while.